Enhancing Internet Resilience with Spatial Analysis
In short
- Crowdsourced data is critical for measuring Internet resilience at a local level, however limited coverage can be challenging.
- Spatial analysis helps by turning scattered data into a cohesive regional map of Internet performance.
- New study shows a combination of statistical techniques can provide a clearer picture of local Internet performance than using census or neighborhood boundaries.
A reliable Internet connection has become a necessity for remote work, online learning, and entertainment. Yet, Internet performance varies significantly based on where we live. Understanding these disparities at a local level is essential for ensuring a resilient Internet.
Ookla Speedtest and M-Lab provide valuable crowdsourced datasets for understanding Internet performance. These datasets give insights into various metrics, such as speed, latency, jitter, and packet loss, via user-initiated measurements.
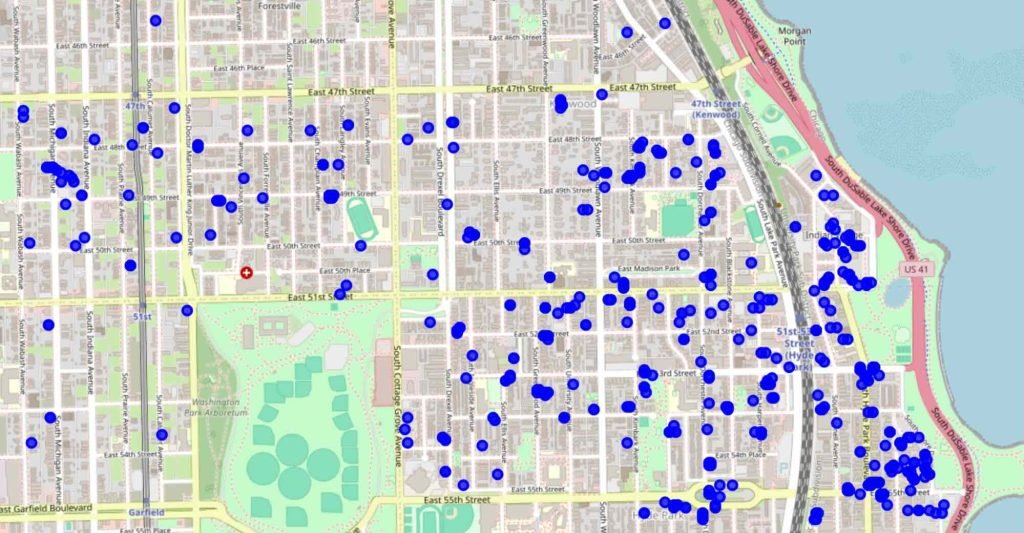
Depending on when and where users conduct measurements, coverage remains far from continuous. As a result, many areas still need to be sampled, and the data collected may be noisy due to differences in devices, times of day, or network conditions.

Despite these challenges, crowdsourced data can offer insights into where the Internet may need improvement. In addition to providing an assessment of Internet performance from a diverse number of vantage points, crowdsourced data provides a cost-effective alternative for specialized measurement campaigns. However, analyzing it effectively requires a strategy for filling data gaps and understanding geographic patterns.
Measurement-driven Boundaries do not Align with Administrative Boundaries
Spatial analysis helps overcome these challenges by turning scattered data into a cohesive regional map of Internet performance. Traditional approaches rely on pre-existing boundaries like zip codes, which may only sometimes align with how Internet infrastructure operates. For example, one part of a neighborhood might have excellent service while another suffers from poor performance. Simply averaging the data can mask these important variations.
Our research focuses on improving Internet performance assessments by defining geographic sampling boundaries that reflect actual performance variations. This is especially important for measuring Internet resilience—the ability of a network to maintain performance during high demand, outages, or other disruptions. By identifying areas of persistent poor performance, we can better target investments to improve network resilience.
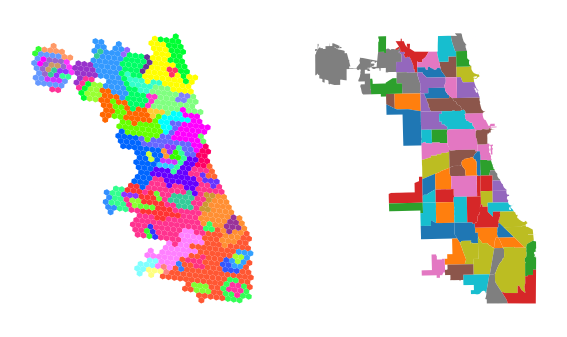
We use a three-step process to determine meaningful geographic boundaries.
- We interpolate the existing data to estimate Internet performance for unsampled locations.
- We overlay small, hexagonal grids to aggregate performance.
- We use clustering techniques to define boundaries that represent regions of similar performance.

This method allows us to identify contiguous areas where latency is particularly high (Figure 3). Latency is crucial for applications like video conferencing, online gaming, and web browsing, making it a strong indicator of overall Internet quality.

In the case of Chicago, we do not observe a one-to-one correspondence between measurement-driven and administrative boundaries for the same number of spatial units (N = 77). These results suggest a significant difference from prior studies that use administrative boundaries to aggregate Internet performance data. We recommend using prior interpolation and high-resolution spatial units for policy-oriented analyses.
Prior Interpolation Reduces Sensitivity to Spatial Unit Choices in Aggregated Results
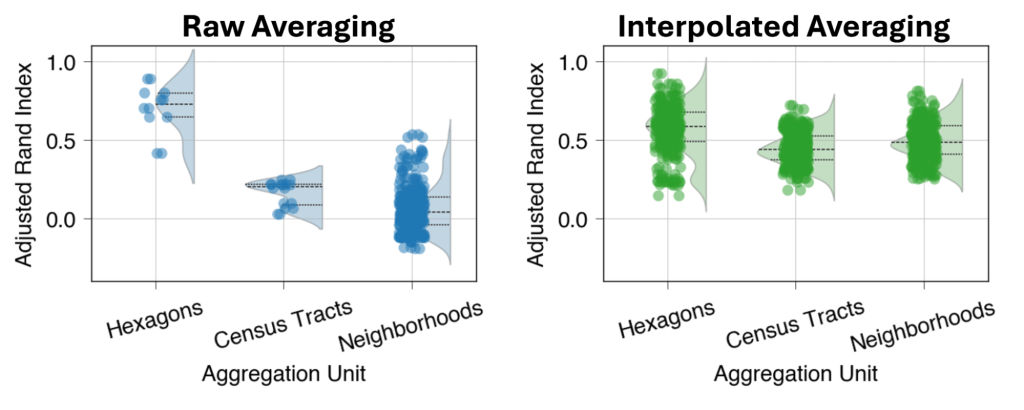
We measure the similarity between 17 monthly clusterings of the crowdsourced data using the Adjusted Rand Index (ARI), measured on a scale of -1 to 1, where:
- -1 = maximum disagreement
- 0 = random boundary assignments
- 1 = maximum agreement.
If we perform simple averaging on scattered measurements, choosing geographic aggregation units affects the similarity of boundaries over time (Figure 4). However, the choice of aggregation unit has less impact when we average grid-interpolated latency estimates — tiny hexagons for aggregation result in a higher boundary similarity in both cases. A median ARI of 0.59 for interpolated averaging with regular hexagons implies a moderate to solid similarity, suggesting that our approach reveals significant spatial structure across monthly fits.

Read our paper for more information about our methods and results.
Taveesh Sharma is a third-year graduate student in Computer Science at the University of Chicago.
The views expressed by the authors of this blog are their own and do not necessarily reflect the views of the Internet Society or, in this instance, The Brattle Group.

