Measuring the Effects of the CrowdStrike Outage on Internet Traffic
In short
- Last year's faulty CrowdStrike update had a nuanced impact on the Internet traffic of various organizations and sectors.
- Interference patterns can hide application fault effects in traditional network-level analysis approaches.
- Service identification and aggregation using DNS information makes these individual waves visible.
On 19 July 2024, the cybersecurity company CrowdStrike rolled out a faulty update for its endpoint protection software. The effects were diverse and global, reportedly affecting 8 million Windows devices and disrupting workplaces, airports, and health services worldwide.
Read: Global Tech Outage Demonstrates Need for Resiliency in Software Systems
Considering the widespread effect, we at the Max Planck Institute for Informatics and Benocs GmbH decided to study how this service level outage impacted Internet traffic.
Our analysis demonstrated that traditional aggregate network-level metrics provide limited information on large application-level disruptions, requiring us to study their effect on application-level traffic.
The Outage Had Minimal Impact on Internet Traffic...
We approached this study using the established lens of traffic-focused network measurements, analyzing the effects of the CrowdStrike incident on the Internet traffic of four European Internet Service Provider (ISP) networks and one European Internet Exchange Point (IXP) network.
While we saw a noticeable decrease in traffic for ISP-1—around 8.5% on the day of the outage—we didn't see the same occurring in the other ISPs or IXP.
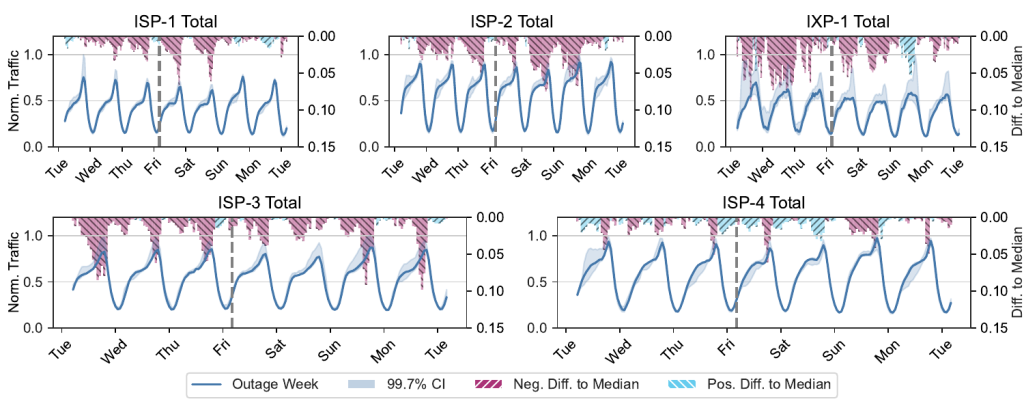
We attempted to see any effects using other network-level metrics, such as port-level, subnet-level traffic, and packet sizes, but we reached the same conclusion. See our paper for more details.
...But it Did Have a Significant Impact on Other Applications and Services
Given the above, we used a different methodology to correlate flows with DNS-level traces and infer traffic levels per application. An application consists of a manually curated set of domains, and we had traffic volume inference for approximately 1,500 pre-selected applications. Luckily, CrowdStrike was one of them!
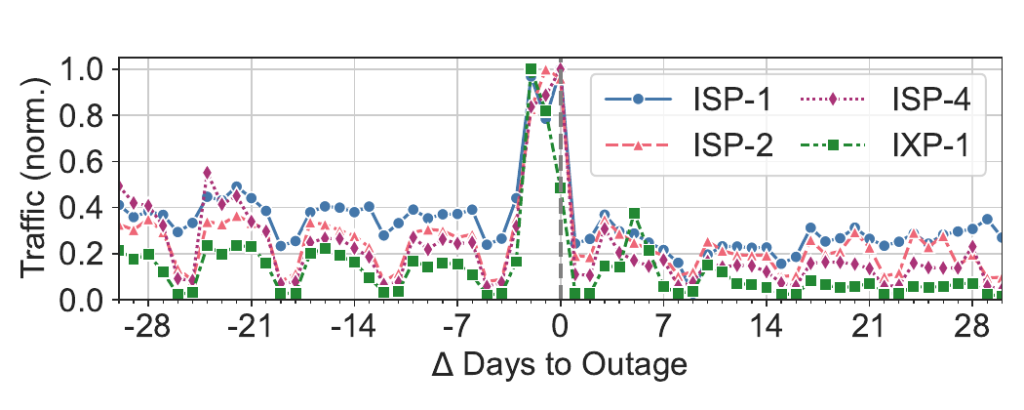
In Figure 2, we see across all the ISPs and IXP:
- An increase in traffic towards CrowdStrike on the day that likely corresponds to the rollout of the update, and
- A subsequent decrease in network traffic to the application. The traffic volume in the period from seven to 28 days after the incident was between 28.8% (ISP-2) and 60.5% (IXP-1) lower than the volume from seven to 28 days before. Weekly traffic volumes for ISP-5 and ISP-2 returned to pre-outage levels around six months after the incident.
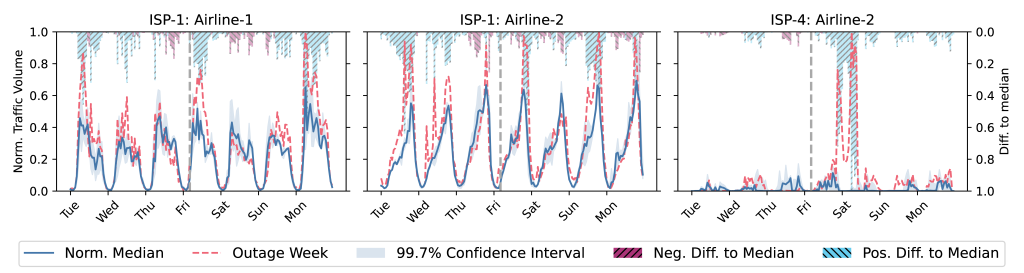
Since the incident affected many dependent services and organizations, we also analyzed select reported applications for their traffic volumes and deviations from the norm.
Figure 3 shows the most significant effect. Here, two affected airlines observed traffic increases shortly after the outage. For Airline-1, this effect is especially prevalent on Friday and Monday. Airline-2 observes a considerable spike in ISP-4 but also shows increased traffic in ISP-1.
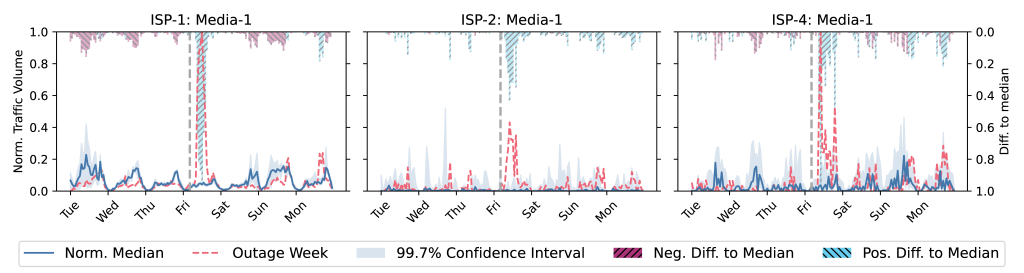
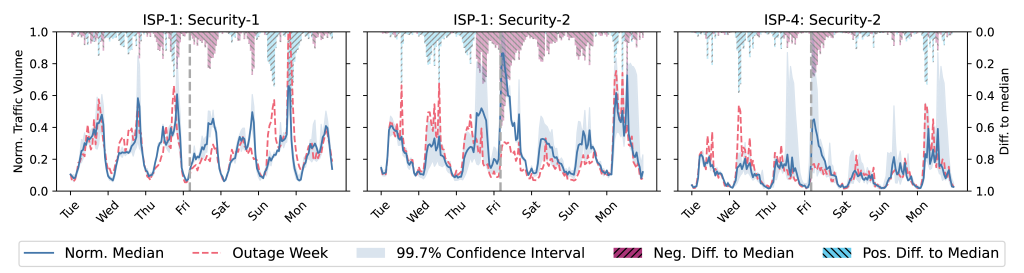
Figures 4 and 5 also show impacts on other applications like Media and Security.
With systems across the Internet becoming increasingly dependent on each other, a single point of failure can lead to widespread issues, as the CrowdStrike and more recent Google Cloud outages have shown. As such, application-level monitoring and semantically enriched network traces will become increasingly crucial for detecting and analyzing such outages. Read our paper to learn more.
Vaishnavi Raghavajosyula is a PhD student at the Max Planck Institute for Informatics and a 2025 Pulse IPv6 Research Fellow.
The views expressed by the authors of this blog are their own and do not necessarily reflect the views of the Internet Society.
Photo by Smishra1 Via Wikimedia Commons