
Visualizing The Rise of Hypergiants
In short
- Studying changes in the deployments of hypergiant content delivery networks and content providers helps uncover trends in how these key players adapt to and drive shifts in the modern Internet ecosystem.
- AWS has a presence in the largest number of cities in Asia, Microsoft and Meta in Africa, Cloudflare in Europe and North America, and Akamai in South America.
- Meta, Amazon, Akamai, and Fastly have higher IXP capacities than other hypergiants, indicating a greater use of public peering.
Our daily Internet experience relies on the vast and complex infrastructures operated by a small number of Content Delivery Networks (CDNs) and Content Providers (CPs), which are sometimes referred to as hypergiants.
While their infrastructure is mainly unnoticed by end-users, their geographic reach and interconnection strategies significantly shape how the Internet functions. Tracking how hypergiants expand and refine this infrastructure is crucial for researchers, network operators, and policymakers, as it impacts performance, competition, and the resilience of global connectivity.
Hypergiants build their infrastructure around three key components that work together to guarantee that their content is served quickly and reliably:
- Large data centers are hubs for storing and processing vast amounts of content.
- Points of Presence (PoPs) are located in colocation facilities or Internet Exchange Points (IXPs) where hypergiants interconnect with other networks, such as ISPs and transit providers. PoPs bring content closer to end-users, improving speed and reliability.
- Private wide-area networks and the public Internet interconnect these data centers and PoP to ensure efficient traffic flow across regions.
Because PoPs are essential for efficiently delivering content to end-users, hypergiants are incentivized to disclose their locations to facilitate peering with other networks. PeeringDB is a community-driven project that catalogs this data. It has become a key resource for network operators to identify and coordinate interconnection opportunities.
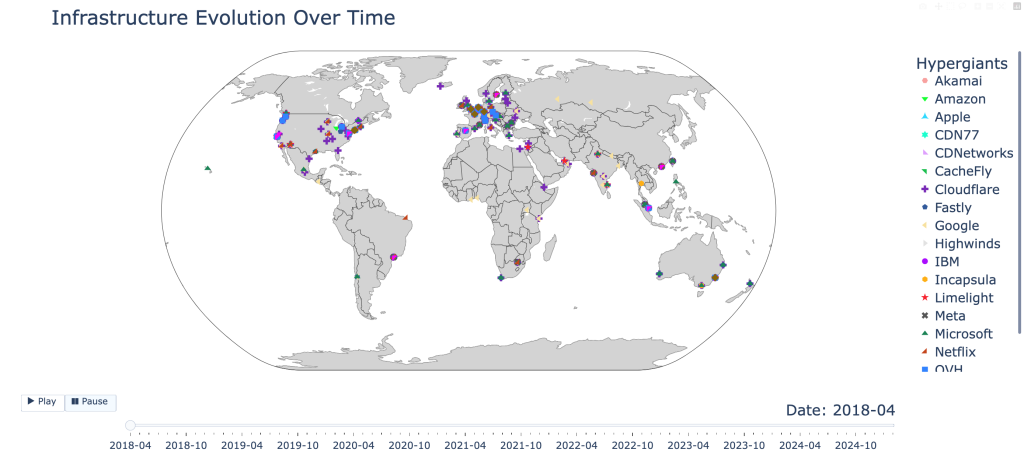
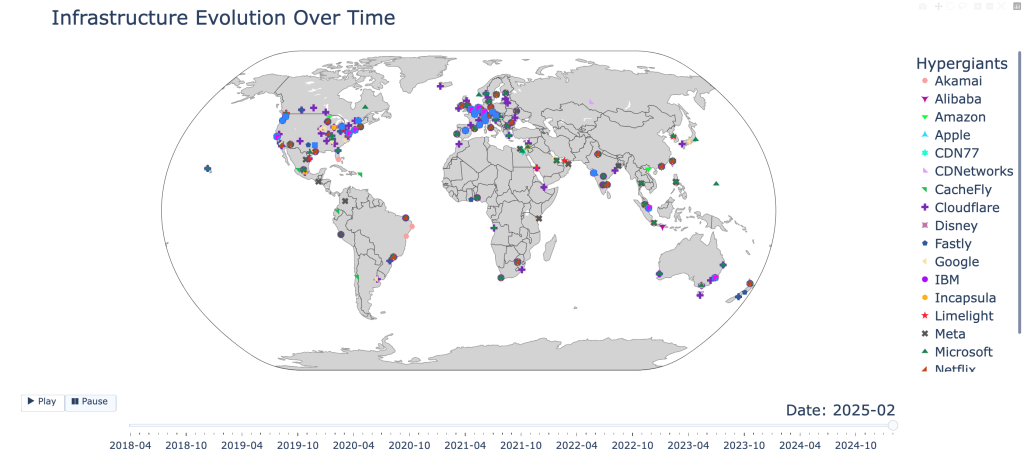
This blog post analyzes historical PeeringDB datasets from March 2018 until the present to examine how the peering footprint of 22 hypergiants—identified in prior research—has evolved. By studying changes in their PoP deployments, we aim to uncover trends in how these key players adapt to and drive shifts in the modern Internet ecosystem.
Read: Hypergiants are Increasingly Serving More Content Via Local IPv6 Networks
Akamai Maintains Steady Growth, Cloudflare and Fastly Expand Aggressively
Figure 1 shows Cloudflare (purple) and Akamai (red) have expanded their presence the most, appearing in more than 200 interconnection facilities worldwide in 2025. Google (green), Amazon (light green), and Microsoft (black) also show steady and sustained growth, indicating consistent efforts to extend their network footprints globally.
Meanwhile, Netflix (orange) and Fastly (navy blue) had periods of rapid expansion (up until early 2022 for Fastly and 2021 for Netflix) but have since slowed down, suggesting a shift or consolidation in their infrastructure strategies. In Netflix’s case, the surge in interconnection facilities where they have a presence may have been a response to the increased demand during the COVID-19 pandemic.
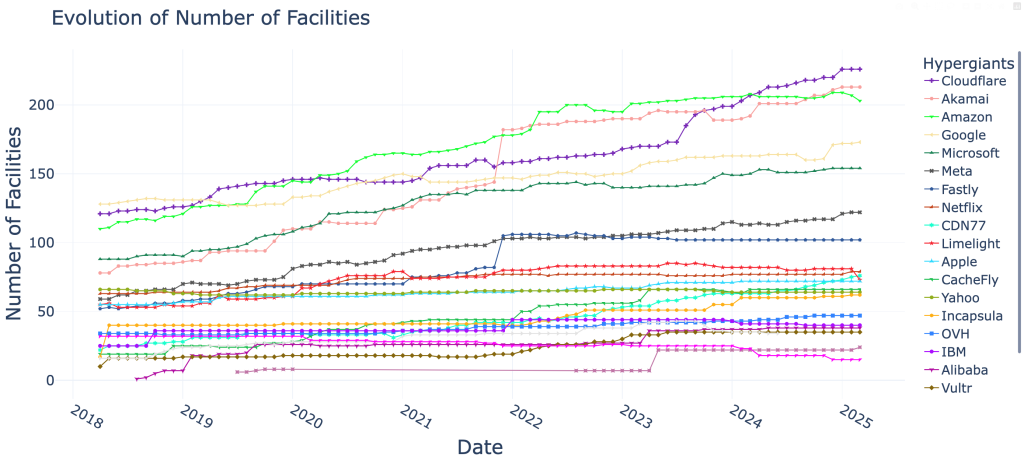
Interestingly, in December 2021, we noticed a spike in the number of PoPs for Fastly and Akamai. A contact at Fastly explained that many of these PoPs were set up months earlier, with the delay attributed to manual processes for bringing PoPs online and updating PeeringDB. A similar jump in the number of PoPs can be observed for Akamai at the same time, raising the question of whether this was merely a coincidence or part of a broader pattern—perhaps an end-of-year update or reporting cycle?
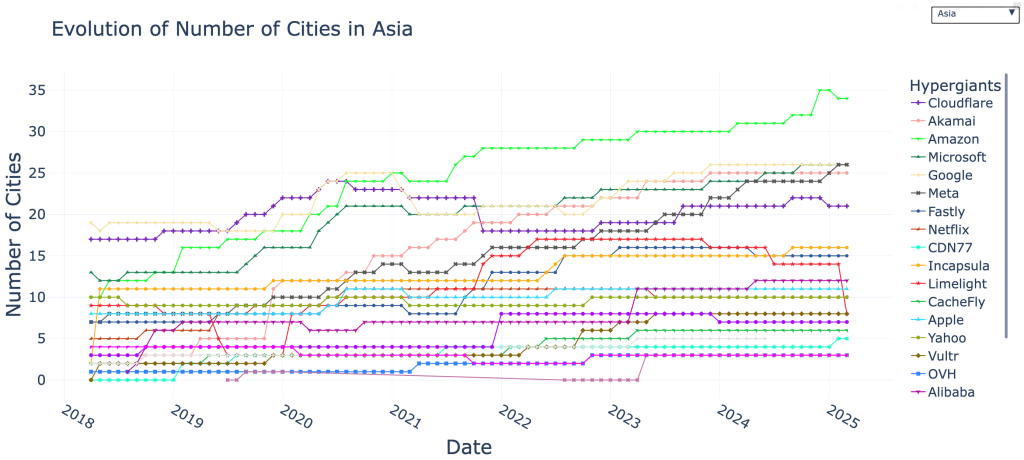
AWS Has a Presence in the Largest Number of Cities in Asia, Microsoft and Meta in Africa, Cloudflare in Europe and North America, and Akamai in South America
AWS has the most presence among hypergiants in Asian cities, particularly in India, the Middle East, and Southeast Asia (Figure 2). Its strong footprint in the Middle East stands out, as AWS is the most widely deployed hypergiant in the region—a unique trend that warrants future investigation.
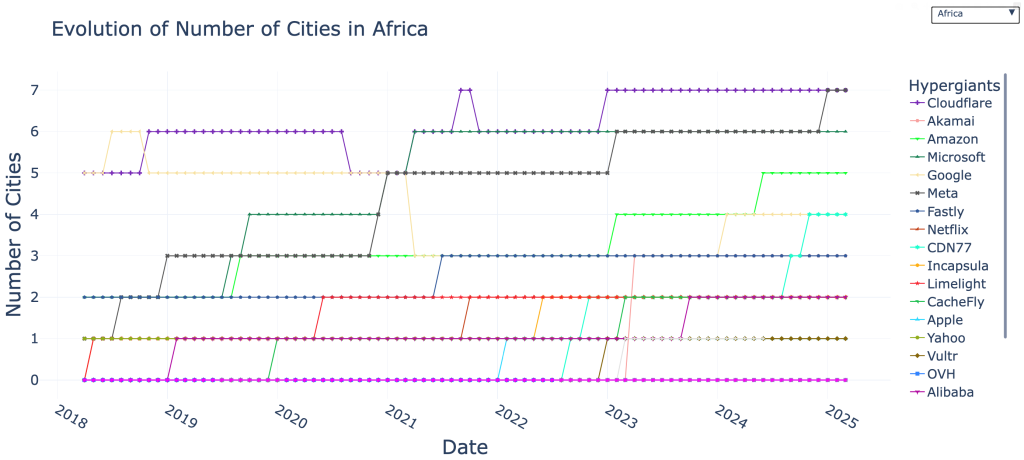
In Africa (Figure 3), Cloudflare, Meta, and Microsoft are present in the most number of cities (although this is a small number compared to other continents). In contrast, Google has scaled back its footprint from 5 to 3, reducing the number of cities and countries where it previously operated. These reductions might hint at a shift toward consolidating infrastructure in fewer countries or different regional strategies.
Africa remains the continent with the fewest cities covered by hypergiants, highlighting a variation of the well-known digital divide. In some parts of Central Africa, the nearest hypergiant PoP is more than 2,500 km away, likely leading to poor service in those regions.
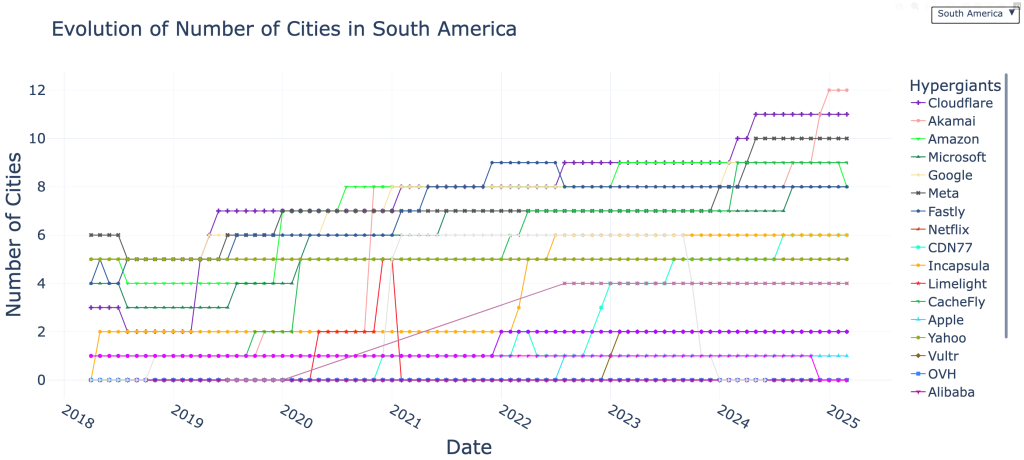
Cloudflare has the most extensive and growing footprint in Europe and North America. Meanwhile, in South America (Figure 4), Akamai has significantly increased the number of cities in which it has a presence since 2024, raising questions about whether this shift is driven by new market opportunities, infrastructure upgrades, or changing customer demands.
Read: How Foreign Networks are Changing Internet Landscape in Greece
PoPs Turnover is Faster Than We Expected
Our analysis reveals that PoPs are added and removed much faster than previously thought. While PoPs are often associated with long-term infrastructure investments, the data points to a dynamic and constantly evolving landscape.
This turnover may be driven by shifting traffic demands, changing interconnection strategies, or hypergiants' efforts to optimize costs. The decommissioning of PoPs in some regions and their redeployment in others highlights the flexibility of these networks to adapt to regional needs.
These findings challenge the notion of PoPs as static infrastructure and might suggest a need for more streamlined approaches to selecting PoPs and peers to ensure available resources are allocated efficiently and unnecessary investments are minimized.
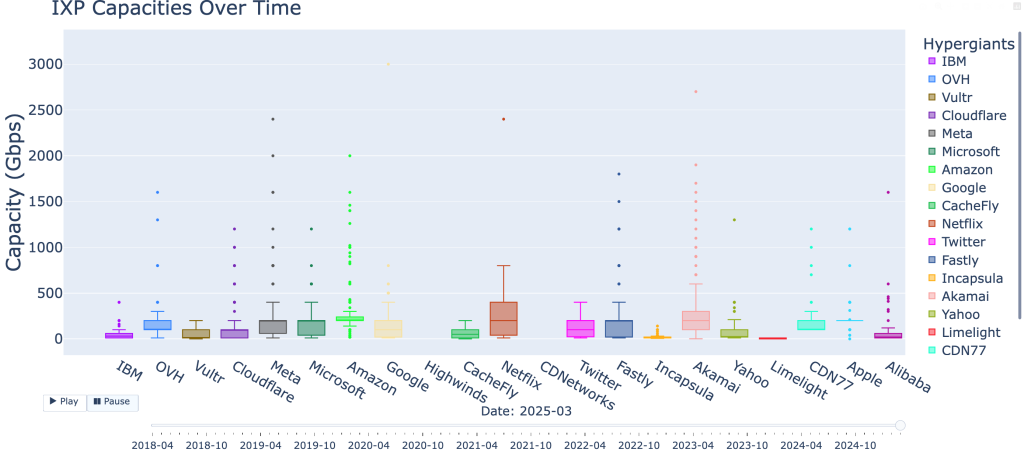
Capacity at IXPs Remains Low for Most Hypergiants With the Notable Exception of Brazil
The difference in IXP capacity among hypergiants reflects their different interconnection strategies.
These links are most likely used as backups or for low-priority traffic rather than as primary interconnection points. However, there are a few exceptions to that rule in certain regions and for specific hypergiants:
- Brazil's IXPs are among the largest in the world and, in turn, provide hypergiants with more capacity. Understanding the historical and market conditions that led to the increased importance of IXPs in Brazil would be an interesting area for further investigation. See IXP capacity growth over time in Brazil.
- Meta, Amazon, Akamai, and Fastly stand out with higher-than-average IXP capacity, suggesting they use IXPs more extensively than other hypergiants. Akamai and Fastly explicitly state in their peering policies that they are open to peering with everyone at these facilities. Meta and Amazon also maintain a relatively high capacity, indicating that IXPs still play a role in their interconnection strategies. This approach contrasts sharply with Google, which has recently announced plans to remove itself from most route servers, likely due to performance concerns and increased contention.
Learn More
This blog post is not intended to provide definitive answers but rather to highlight a few interesting observations on the deployment of hypergiant content delivery networks and content providers to uncover trends in how these key players adapt to and drive shifts in the modern Internet ecosystem. We hope the visuals we’ve created will be useful to fellow researchers in their own investigations.
The results are presented as animations for researchers to explore on my personal webpage (Evolution of the PoPs on a map, IXP capacities from different hypergiants, time series of cities for different hypergiants, time series of countries for different hypergiants, and time series of facilities for different hypergiants), and the raw processed data is available upon request via email.
Contributors: Ethan Katz-Bassett
Loqman Salamatian is a PhD candidate at Columbia University, researching Internet measurement, model analysis, and Riemannian geometry, aiming to develop models that bridge virtual and geographical spaces.
The views expressed by the authors of this blog are their own and do not necessarily reflect the views of the Internet Society.