
E-Government Development Index: What’s Changed Since 2022
In short
- The E-Government Development Index (EGDI), provides a snapshot of digital progress and allows users to track and compare the progress of their own and other countries and regions
- The overall EGDI has increased by more than 2%, predominantly due to strong e-government development in Asia.
- The majority of least developed countries (LDCs), landlocked developing countries (LLDCs), and small island developing states (SIDS) rank below the global EGDI average, predominantly due to inadequate technological infrastructure, susceptibility to cyber threats, and the effects of geographic isolation.
The United Nations recently released the 13th edition of its E-Government Survey.
Held every two years, the survey assesses national and subnational online services provision and relevant technology infrastructure and human capital indicators across 193 Member States, assigning values to various features relating to digital government development.
The resulting data is collated in the E-Government Development Index (EGDI), which provides a snapshot of digital progress and allows users to track and compare the progress of their own and other countries and regions.
The Pulse Internet Resilience Index includes the EGDI score in its market readiness — having robust e-government services indicates significant local Internet traffic/content being routed, created, and consumed. Creating and hosting content locally reduces the time and cost it takes for people to access it, making the Internet faster and more affordable.
Read how the Internet Society is enabling countries to keep at least half of all Internet traffic local by 2025.
Below is a summary of the key takeaways from the 2024 Report.
What's Changed Since 2022
Quite a lot. The global EGDI average has increased from 61.02% to 63.82%, with 71.5% of Member States recording high or very high EGDI levels, up from 68.91% in 2022.
Most significantly, the proportion of the population lagging in digital government development has decreased from 45% in 2022 to 22.4%, mainly due to considerable development in Asia and steady improvement in the Americas.
Asia's EGDI average has increased by more than 12% since 2018, followed by Africa (8.24%), the Americas (8.03%), Europe (7.66%), and Oceania (6.78%).
Europe (84%) and Asia (43%) have the highest percentage of countries with very high EGDI ratings. In comparison, 31% of the Americas, 14% of Oceania (Australia and New Zealand), and 2% of African (Mauritius and South Africa) countries rank very high.
Most countries in the Americas (57%) are rated as having high EGDI scores, while most countries in Oceania (57%) and Africa (52%) have middle EGDI ratings.
At a country level, Denmark, Estonia, and Singapore scored the highest EGDI rankings in 2024. The latter was one of five countries in the top 20 that experienced significant e-governance development in the last two years. Bahrain, Germany, Ireland, and Saudi Arabia also climbed into the top 20 in 2024 at the expense of Austria, France, Israel, and Malta.
LDCs LLDCs SIDS
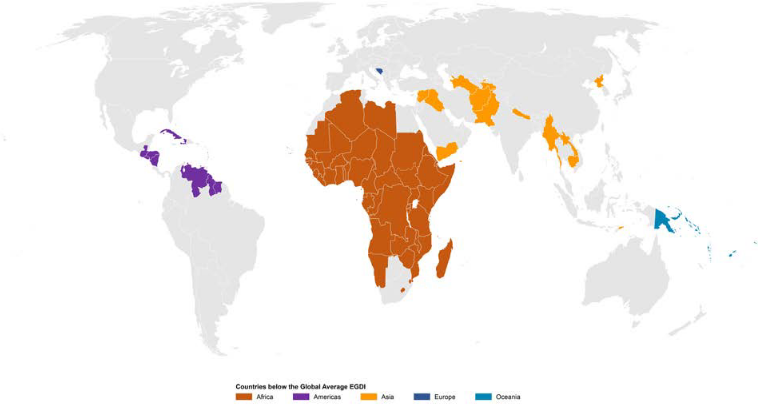
The majority of least developed countries (LDCs), landlocked developing countries (LLDCs), and small island developing states (SIDS) rank below the global EGDI average, predominantly due to inadequate technological infrastructure, susceptibility to cyber threats, and the effects of geographic isolation.
Encouragingly, three countries—Bangladesh, Bhutan, and Jamaica—climbed above the global average between 2022 and 2024. This follows the trend of many other countries in this group experiencing significant development since 2018, including led by the likes of Singapore, Mongolia, Armenia, Kazakhstan, and Paraguay.
Those who have seen their ranks fall most at the same time have mainly done so because the countries below them have developed their e-government capacity rather than seeing their own e-government capacity deteriorate significantly.
The most notable concern from the above chart is the countries stuck in the middle, which have not developed their e-government capacity at the global average rate —the map below illustrates the locations of these countries.
Digital government initiatives are powerful tools for accelerating and implementing the Sustainable Development Goals (SDGs). As such, regular measurement and evaluation are crucial to ensuring accountability and justifying the investment of public resources, strengthening public trust in digital government, and ensuring the resilience of the Internet.
To this end, the Pulse team plans to contribute to this line of research and study where e-gov services are hosted and understand the robustness of the hosting infrastructure. Stay tuned.