
Case Study: Ukraine – A Role Model for Internet Resilience
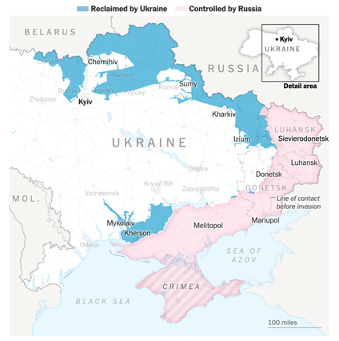
On 24 February 2022, Russia began a large-scale invasion of Ukraine, disrupting Internet services around the country. As the war unfolded, Internet infrastructure was damaged, power plants were destroyed, and cell towers in some cities were torn down by Russian missiles, cutting off mobile connectivity to many Ukrainians.
Holding Steady
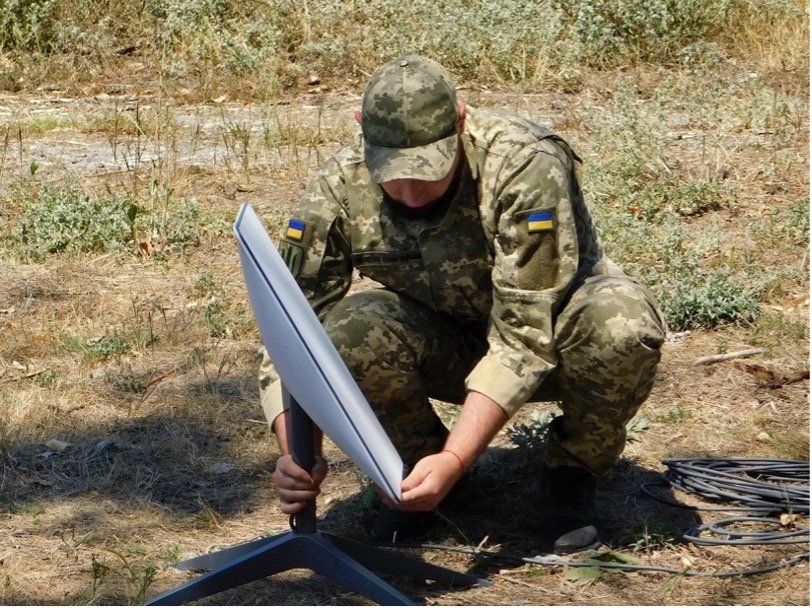
Yet, the Internet in Ukraine remained surprisingly resilient. We saw the mobilization of telecom engineers on multiple occasions to fix damaged fiber links and cell towers. The country also received thousands of Starlink terminals, which were mostly used as backup links both by Ukrainian civilians and the military (see lead photo above - source: Wikimedia).
The Internet was designed with resilience in mind and, in many cases, well-connected networks can route traffic around any damaged parts. We saw how the Internet withstood high traffic demand during COVID-19 without suffering from major disruptions. Similarly, while we have observed a small amount of performance degradation in several cities since last February, we also saw significant robustness of the routing core in Ukraine. We saw very little fluctuation in Ukraine’s international connectivity, which confirms the resilience of the Ukrainian Internet ecosystem.
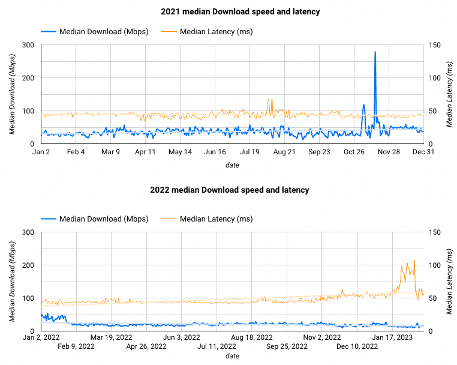
In this case study, we looked specifically at network performance in terms of throughput (speed) and latency (minimum RTT) using data from Measurement-Lab’s Network Diagnostic Tool (NDT). NDT test clients are run on both mobile and desktop devices and capture how fast the device can upload/download an object via a WebSocket over TLS to Measurement-Lab servers currently located in Belgrade, Sofia, and Warsaw.
We analyzed NDT measurements for a year from 1 January 2022 to 31 December 2022. We also compared our measurements with the previous year's (1 January 2021 to 31 December 2021) data, which we use as a baseline. Our first observation was the number of test counts in 2021 and 2022. While we would assume that during wartime, running performance measurements wouldn’t be a priority, the number of test counts increased drastically in 2022 (around 530k) compared to 2021 (around 130k) in 2021 – a 300% increase.
NDT Measurement Activity
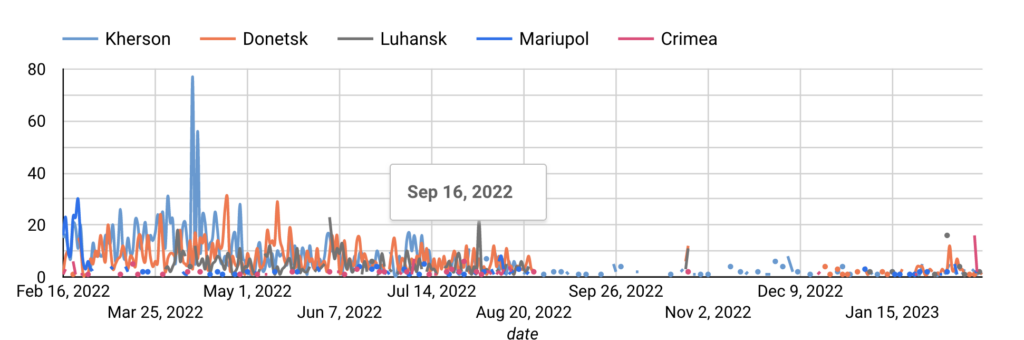
From the heatmap below, we can observe how the tests shifted from one region to another. We see a higher concentration of tests being run in the west of the country (close to the border with Poland, Slovakia, and Hungary) and a decrease in the number of tests in the regions now controlled by the Russian military. Most likely, the Internet infrastructure in the Russian-controlled areas was affected, making it harder or impossible for people to run the tests.
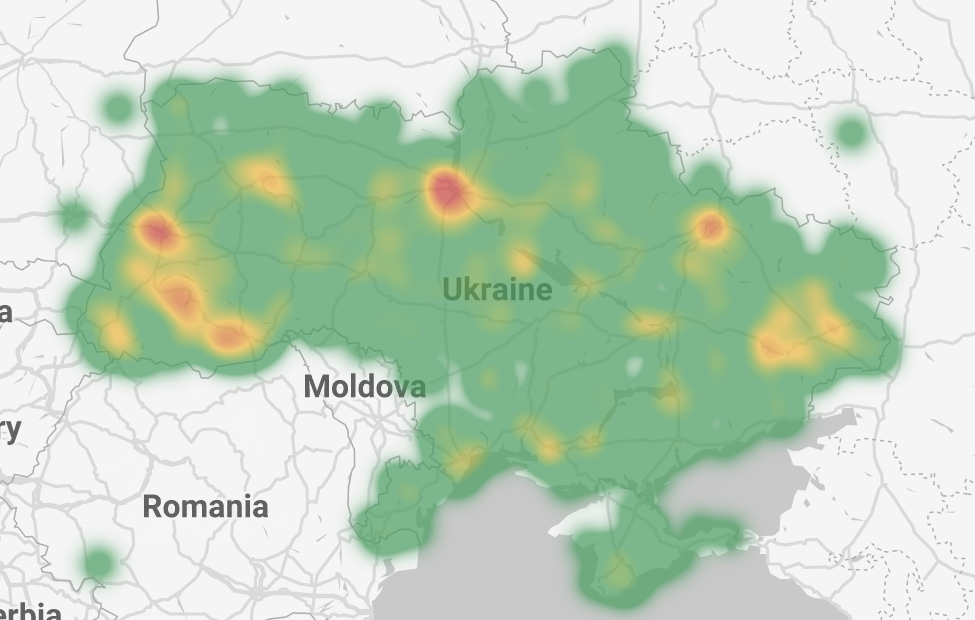
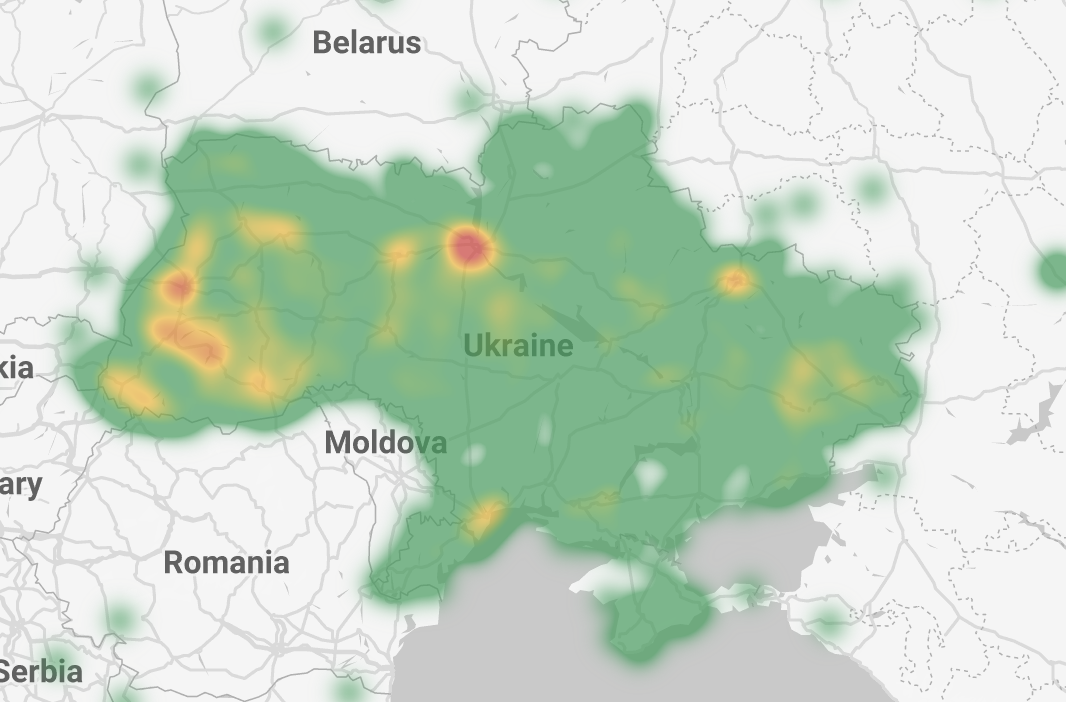
Figure 3 — NDT Test count comparison between 2021 and 2022.
A closer look at Internet performance in the Russian-controlled cities showed a lower number of NDT tests performed. Almost no tests were conducted after August 20, 2022. The Kherson region was engaged in active conflict throughout August-September 2022. Shortly after this, Ukraine regained control over this area.
Throughput and Latency
In 2022, we observed an overall degradation of performance for both throughput and latency. In 2021, the median throughput recorded ranged between 30 and 55 Mbps in 2021 and oscillated between 15 Mbps and 25 Mbps in 2022. Regarding latency, we saw a slow but steady increase (degradation) from 40ms to 60ms in 2022. In 2021, the average latency was less than 45ms.
Most of the networks surveyed experienced some amount of degradation during the invasion. For example, Kyivstar (AS15895), one of the most popular ISPs, experienced increased latency and decreased throughput, while Lanet Network (AS39608) did not experience any degradation above the baseline: both ISPs serve the capital city and the surrounding area.
A Glance at Ukraine’s Routing Stability
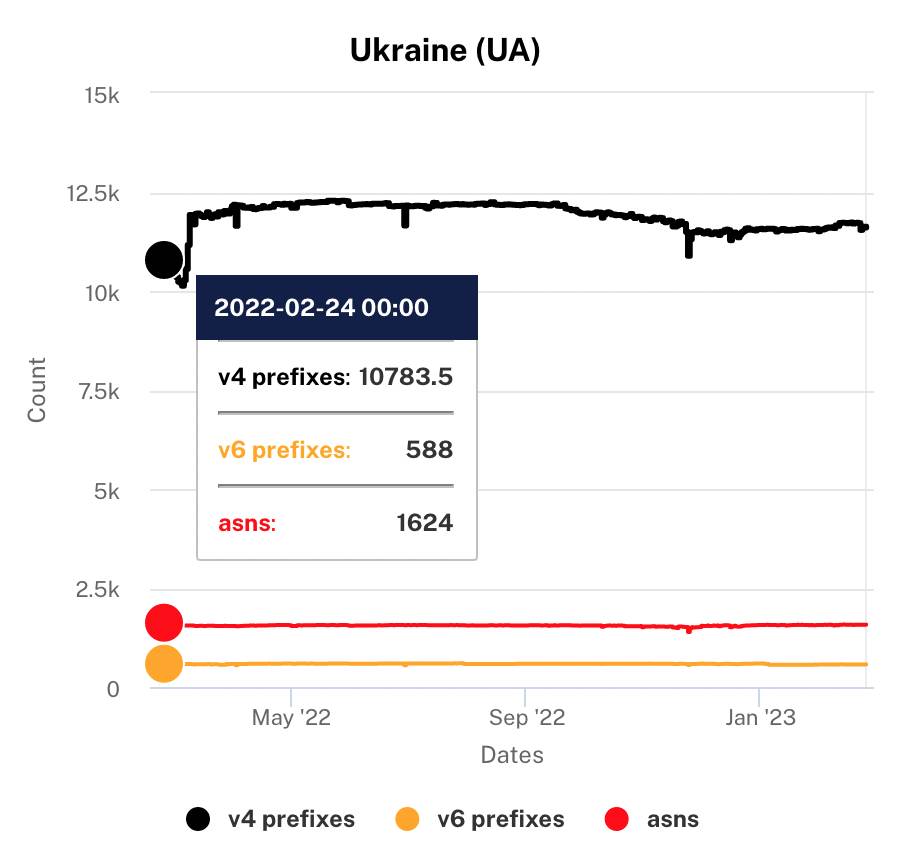
Ukraine currently has 2,190 allocated Autonomous System Numbers (ASNs), out of which 1,793 are currently in use. Around the same time last year, there were 1,822 ASNs appearing in the routing table, only 29 ASNs less than in 2022 (see a more detailed explanation here). The number of routed prefixes for both IPv4 and IPv6 did not change much over the past year, except in early March 2022, when a dip in the number of IPv4 prefixes was observed. Other than that, Ukraine’s routing ecosystem seems pretty much stable.
Now, let’s have a deeper look at path changes between networks in Ukraine and their respective upstream providers over the past year. The paths show us through which networks a packet transits to reach a given destination. This in turn helps us understand the relationships between different types of networks, and how their traffic is delivered to the destination. The idea here is to understand how resilient the connections are between the access networks and border gateways that provide international connectivity to Ukraine. For this, we focused on the 10 main access networks, i.e. those with the greatest market share as per APNIC Labs.
We used the M-Lab Scamper traceroute dataset to understand routing path changes between the two endpoints. For every TCP connection to an M-Lab server, the traceroute core service collects network path information between the server and the client. Using RIPEstat, we selected the top five providers of each Ukrainian network and extracted the number of hops seen between each customer-provider pair, and compared the number of tests performed between 2021 and 2022. For Ukraine only, there were 1,470,025 traceroute tests performed on various operators between 2021 and 2022. All of the M-Lab test servers are located outside of Ukraine, which means international connectivity is required to perform the tests
One observation was that, for some networks, there was a clear reduction in the number of traceroute tests collected between them and their respective upstream providers. This reduction can be attributed to the decreased speed test activity due to the war. However, in most networks, the number of tests remained comparable to 2021, which means that people still had access to their respective operators.
Ukraine – A Role Model of Resilience
For many years now, Ukraine has been a role model of Internet resilience in the region and has always scored relatively high on the four pillars of the Internet Society Internet Resilience Index (IRI): Infrastructure, Performance, Security, and Market Readiness. During the war, Ukraine could rely on its numerous exit points with the neighboring countries, a well-provisioned network of international connectivity providers, a strong local peering fabric, and well-secured networks to help mitigate security issues such as BGP hijacks and DDoS attacks.
Not only has Ukraine invested in good physical infrastructure, it is also prioritizing repair and maintenance as the war goes on. It also relies on a well-developed and diverse ISP market, with a wide pool of network operators. The Ukrainian IXP (UA-IX) is still operating and allowing local traffic exchange between the country’s different networks. Additionally, most of Ukraine’s ISPs have four or more international upstream providers, which drastically reduces the risk of an outage.
All of the above have contributed to the robustness of Ukraine’s Internet and ensured that most normal operations have been able to continue in the face of the extreme challenges the country is continuing to face.
The blog was made possible thanks to the free and open access to NDT data by Measurement-Lab.
Title photo by Tina Hartung on Unsplash