
Why it is Challenging to Measure Regional Shutdowns
Internet disruptions happen at all levels, from unstable connections in your living room to multiple countries being cut off from the global network. Most of these are unintentional disruptions caused by faulty infrastructure, software updates, or human mistakes.
A small but growing number of disruptions are intentional, including cyberattacks on networks and artificial Internet limitations, such as targeted and enforced Internet shutdowns, throttling, and service-blocking events. So far, in 2024, we have registered more than 100 individual artificial Internet limitation incidents on the Pulse Shutdown Tracker.
Although these incidents have severe consequences for individuals, businesses, and entire societies, accurately measuring and tracking them remains a significant challenge.
Currently, we measure these events using a combination of methods. One method involves monitoring Internet traffic patterns using passive measurement techniques, including analyzing network visibility through Border Gateway Protocol (BGP) announcements and traffic data to detect anomalies or disruptions in connectivity from neighboring networks. Another method involves using active measurements using probes that test access to the network, including websites or servers, to test their accessibility and speed.
Active measurement techniques provide real-time visibility into the network to identify issues before current users may be affected, reflecting the actual access a user has through their network.
Passive measurement techniques collect and analyze historical network performance data. It’s especially useful good for analyzing incidents to understand what went wrong.
Although the latter method provides the highest resolution of the impact of the event, more probes located in a broad geography are needed to make this method more reliable, particularly when the shutdown is at the regional level, covering one or more parts of a country.
The Difficulties of Measuring Regional Shutdowns
One significant issue when measuring and analyzing the Internet at a hyper-local level is the variability of Internet traffic patterns. For example, daily usage patterns, influenced by factors such as time of day, work schedules, and entertainment habits, can create fluctuations in traffic volume. These patterns naturally differ from day to day and week to week (Figure 1).
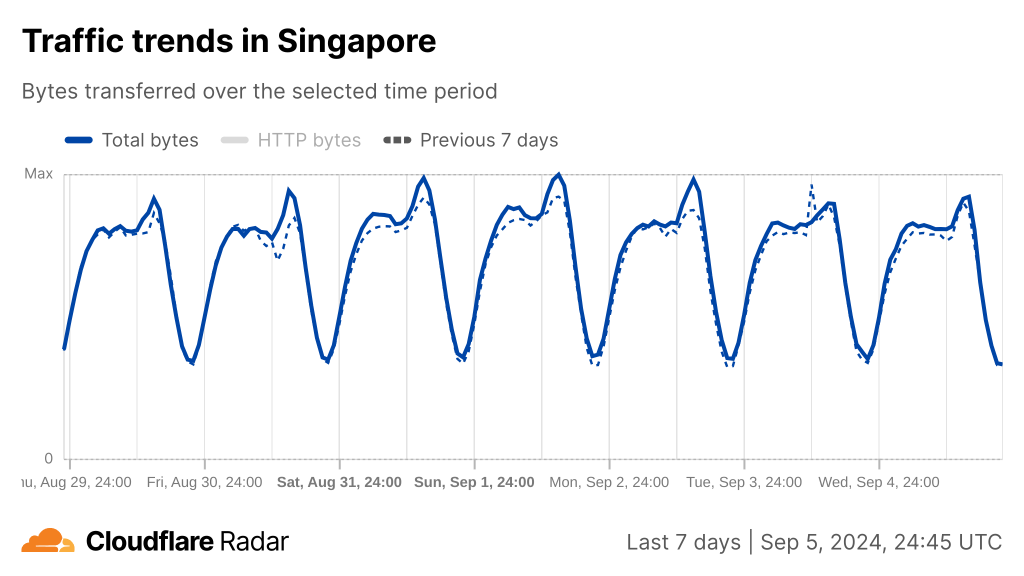
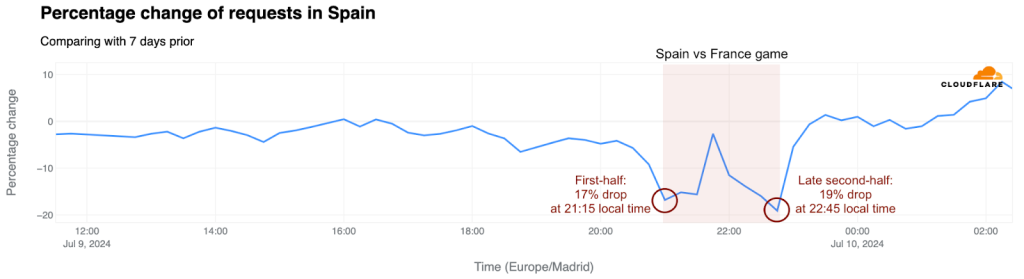
Additionally, special events such as large sporting matches or natural disasters can temporarily spike or dip Internet usage.
Pattern fluctuation makes it difficult to determine the threshold at which a change in Internet traffic can be considered an anomaly large enough to be described as a shutdown. For example, a national shutdown would be clearly visible (~50% drop in traffic and connectivity) across network measurement services. However, a 100% drop in traffic and connectivity at a regional level may not register more than a 10% drop at the national level.
Another limitation is the accuracy of Internet Protocol (IP) location data, which is crucial for pinpointing the geographic scope of a shutdown.
IP geographical locator databases rely on best-effort approaches. Although their accuracy has improved over the years, it is still not at a level that conveys much certainty. For example, there are instances where traffic detected over an IP block used in country A may appear to be coming from country B. When country B is affected by a shutdown, measurements would still show some traffic on the IP block used in country A.
IP geography data is even less accurate at a regional level, with many network operators registering the location of IP blocks at their data centers or headquarters. This means that IP blocks used within the country are effectively concentrated in a few locations within a country. Any drop in traffic in a region would not be attributed to IP addresses in that region but to the country's general traffic.
Measure More
While significant progress has been made in measuring the health and availability of the Internet, these and other challenges will continue to impact our resolution.
We encourage people who wish to improve this situation to download and use open-source active probing tools such as those run by RIPE Atlas Probes and the Open Observatory of Network Interference (OONI).
We also encourage governments to consider establishing indigenous measurement frameworks and contributing data from these to global measurement projects to allow others to monitor and keep related bodies accountable.