Illustration of map of Africa with a load icon overlaid

Internet Remains on in Africa Despite New Cable Outages 

Picture of Kevin Chege
Resilience Insights, Internet Society
Categories:
Twitter logo
LinkedIn logo
Facebook logo
May 13, 2024

Countries in the East and South of Africa are experiencing slower Internet connectivity due to two submarine cables — EASSy and Seacom — being cut during the weekend.

The news comes as the last of the three submarine cables recently damaged off the west coast of Africa from a suspected undersea rock fall was repaired.

Read 2024 West Africa Submarine Cable Outage Report

According to an EASSy cable representative, a submarine cable repair ship has been mobilized and is on its way to the site of the cut, believed to be between South Africa and Mozambique. Depending on the weather and the extent of the damage, the cables are expected to be repaired within two weeks.

In the meantime, Internet Service Providers (ISPs) in affected countries have worked tirelessly to reroute traffic via other unaffected submarine cables and increase capacity via terrestrial cables.

Assessing the Impact

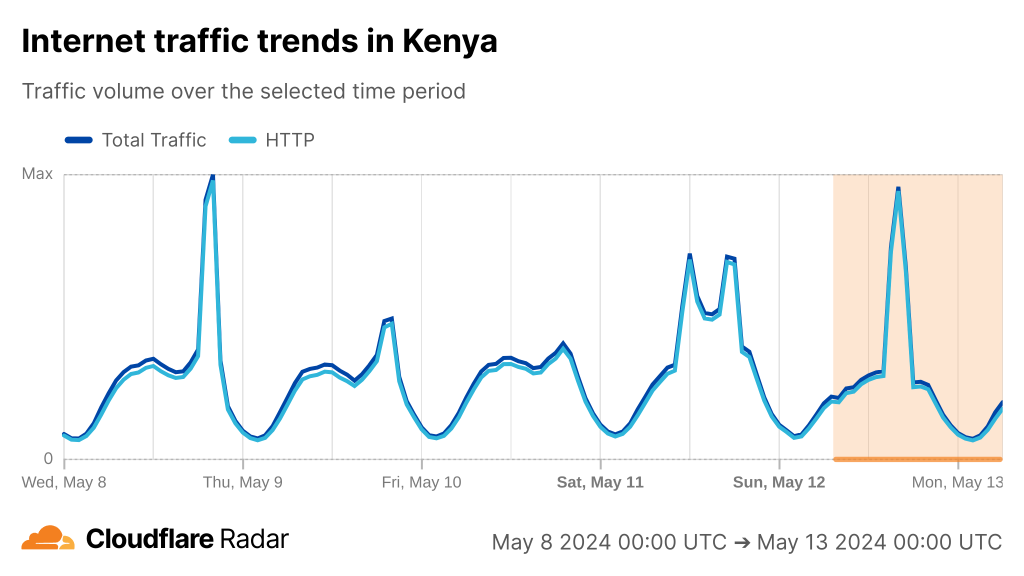
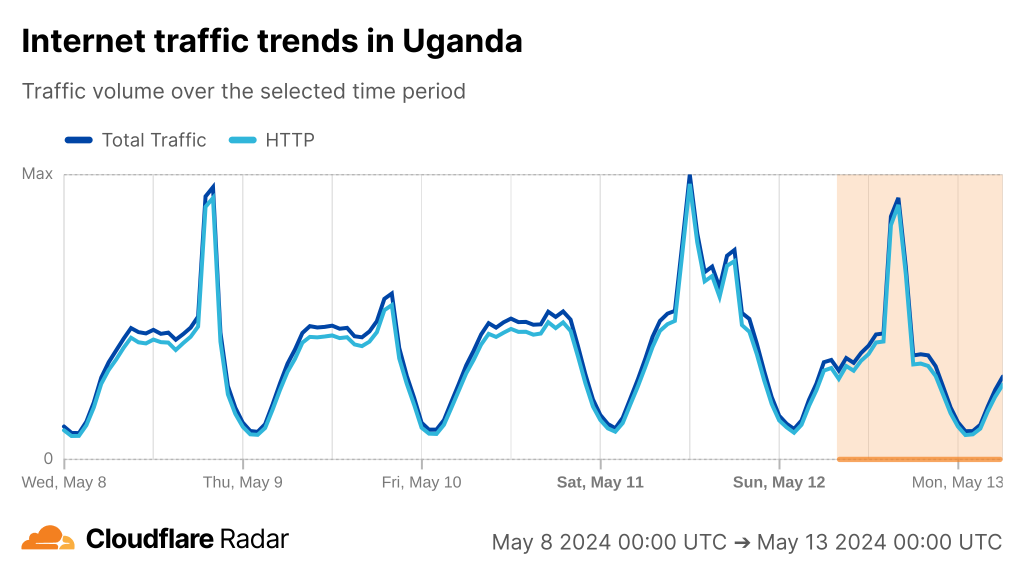
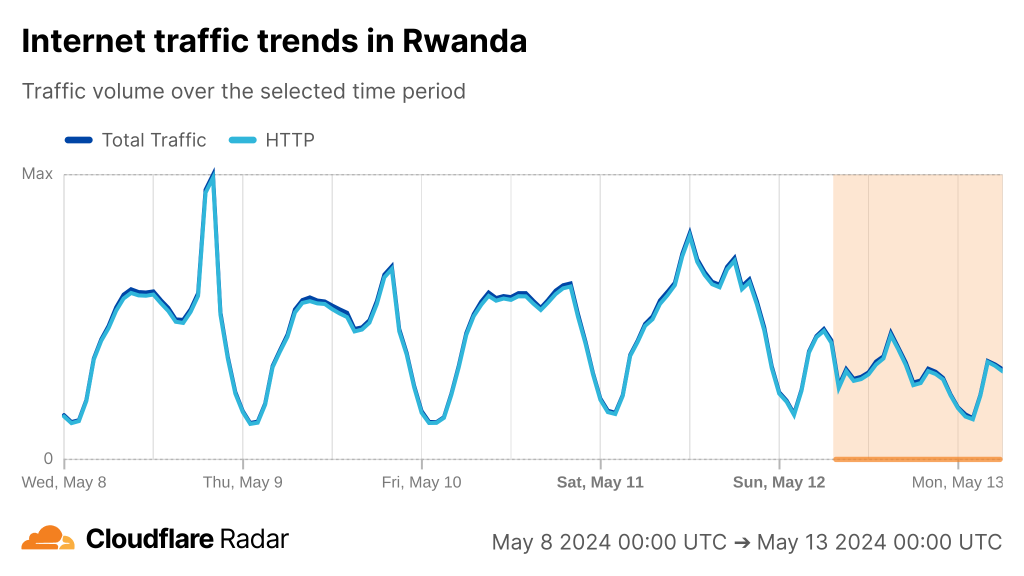
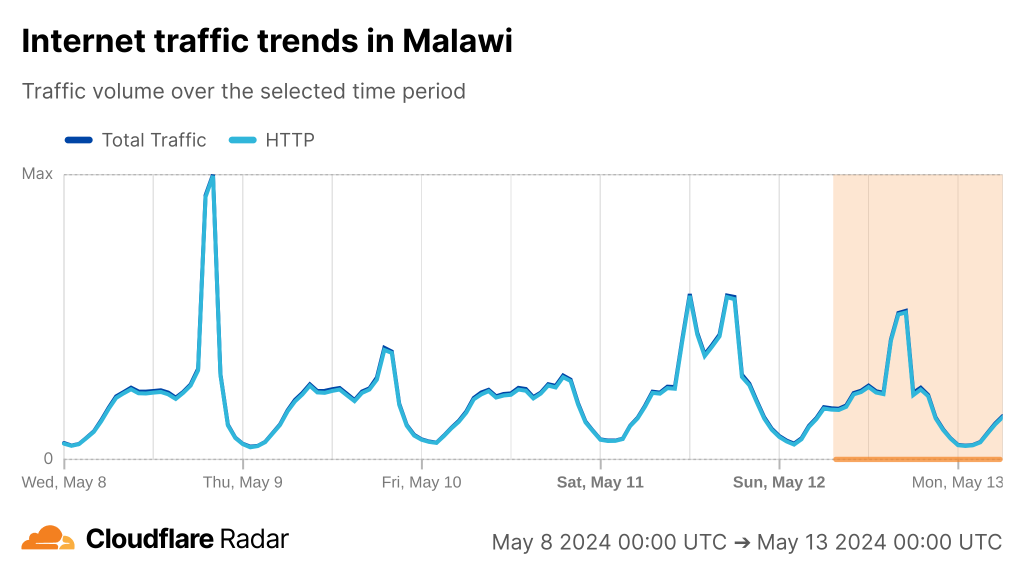
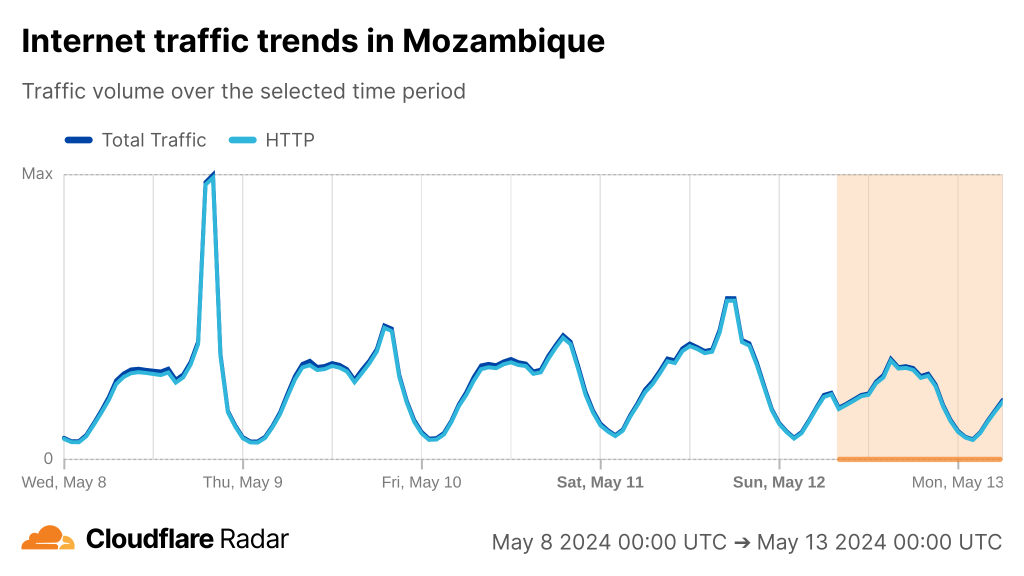
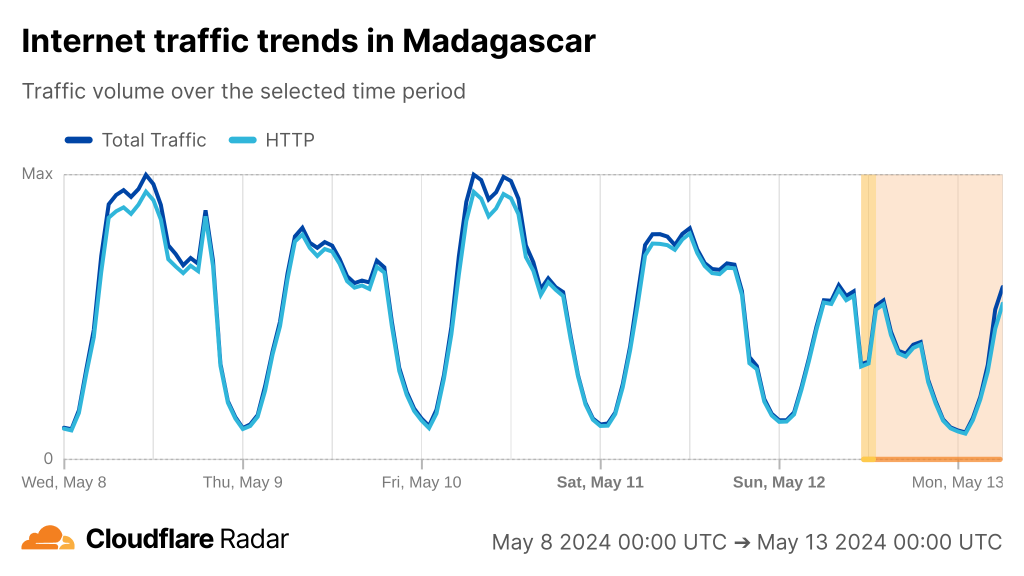
If we look at Cloudflare Radar, we can see the cuts have had a varying degree of impact on countries along the East coast of Africa from Kenya to South Africa.

Time series graph showing Internet traffic trends in Kenya from 8—13 May
Figure 1 — Internet traffic trends in Kenya from 8 to 13 May. Source: Cloudflare Radar.
Time series graph showing Internet traffic trends in Uganda from 8—13 May
Figure 2 — Internet traffic trends in Uganda from 8 to 13 May. Source: Cloudflare Radar.
Time series graph showing Internet traffic trends in Tanzania from 8—13 May
Figure 3 — Internet traffic trends in Uganda from 8 to 13 May. Source: Cloudflare Radar.
Time series graph showing Internet traffic trends in Rwanda from 8—13 May
Figure 4 — Internet traffic trends in Rwanda from 8 to 13 May. Source: Cloudflare Radar.
Time series graph showing Internet traffic trends in Malawi from 8—13 May
Figure 5 — Internet traffic trends in Malawi from 8 to 13 May. Source: Cloudflare Radar.
Time series graph showing Internet traffic trends in Mozambique from 8—13 May
Figure 6 — Internet traffic trends in Mozambique from 8 to 13 May. Source: Cloudflare Radar.
Time series graph showing Internet traffic trends in Madagascar from 8—13 May
Figure 7 — Internet traffic trends in Madagascar from 8 to 13 May. Source: Cloudflare Radar.
Time series graph showing Internet traffic trends in South Africa from 8—13 May
Figure 8 — Internet traffic trends in Mozambique from 8 to 13 May. Source: Cloudflare Radar.

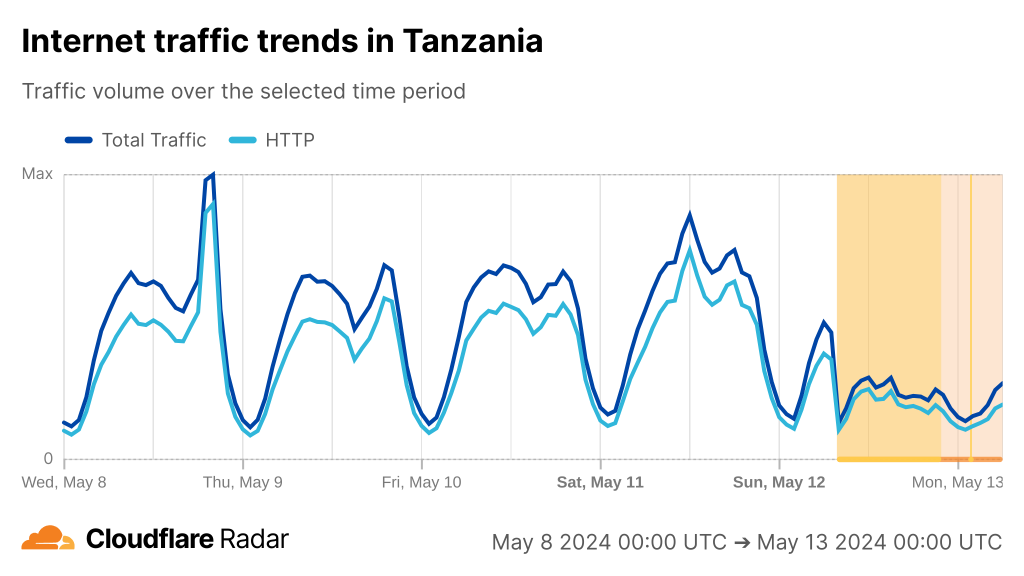
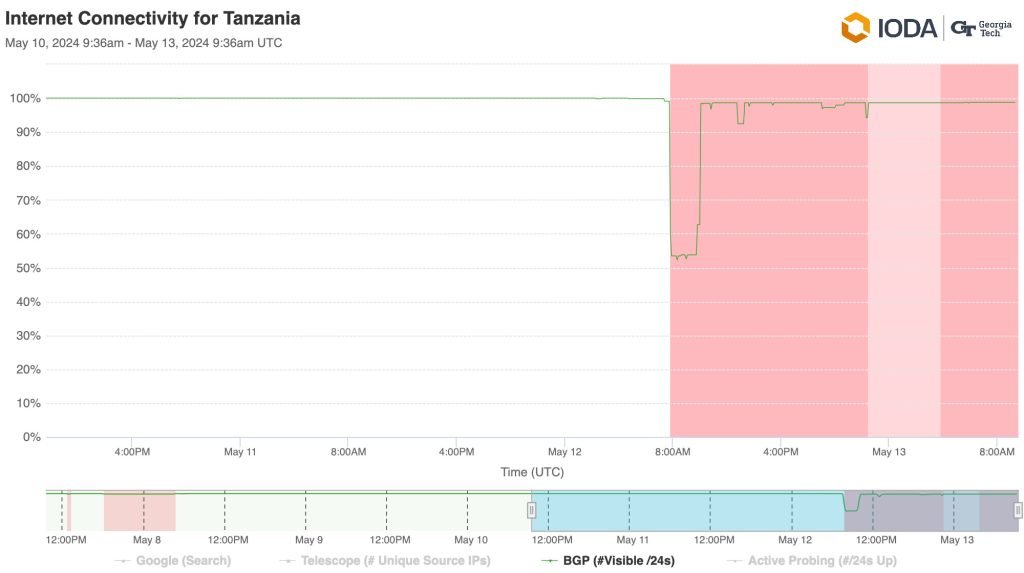
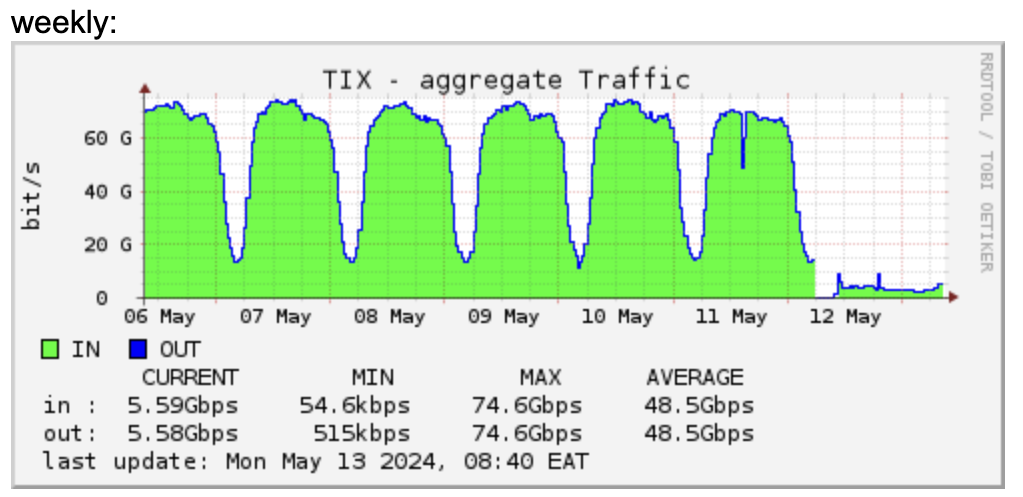
Tanzania has been most affected by the outage, with Internet connectivity falling by nearly 50% nationally, per IODA (Figure 9), and Internet traffic at the local Internet Exchange, TIX, dropping by almost 90% (Figure 10).

Time series graph showing Internet connectivity for Tanzania from 8—13 May, including 50% drop between 8:00 to 11:00 UTC on 12 May
Figure 9 — Internet connectivity for Tanzania from 8 to 13 May. Source: IODA 
Time series graph showing Internet traffic at Tanzania Internet Exchange from 6—12 May.
Figure 10 — Internet traffic passing through Tanzania Internet Exchange from 6 to 12 May. Source: TIX.

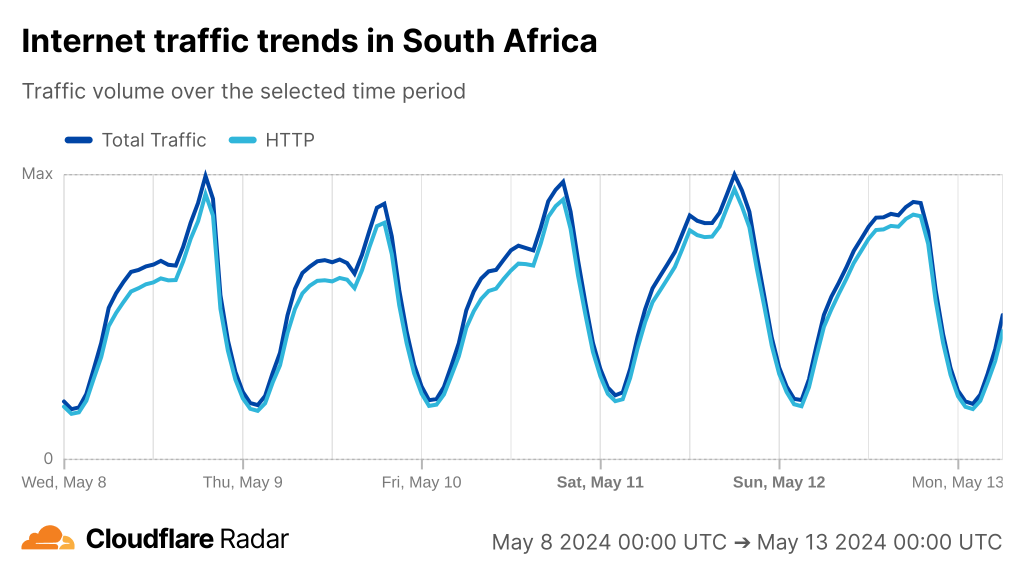
Kenya, South Africa, and Uganda were the least affected by the outage due to their access to other submarine and terrestrial cables and more robust peering ecosystems, whereby many of the country’s networks are connected to one another. This increased ‘interconnectivity’ helps when one path has a fault and allows Internet traffic to be swiftly rerouted via another path.  

These factors contribute to the Internet in these countries, ranking among Africa’s most resilient (see graph below).