IMC’23 Hackathon on Network Interference Using Open Data
Internet censorship and shutdown events have become increasingly common in many countries — in the last 12 months, the Internet Society’s Pulse Shutdown Tracker has recorded 94 shutdown events.
When analyzing Internet censorship and shutdown events, Internet Society curates data from multiple datasets, including OONI, Google Transparency Report, and Cloudflare. Each dataset provides a unique perspective as they are all collected using different techniques. However, observing and confirming censorship events by merging multiple datasets has proved daunting due to varying data formats, access mechanisms, and data collection frequency.
Last month, 16 Internet measurement researchers and graduate students gathered in Montreal, Canada, for the 2023 IMC Hackathon to explore open datasets on network interference with the goal of inferring censorship/shutdown events by correlating multiple datasets. Below is a summary of their outcomes.
Correlate Alarms Across Multiple Datasets
For one of the projects, participants used data from NDT, OONI, Cloudflare Radar traffic, Cloudflare Speedtest, IODA, and the Google Transparency reports to see if there is any correlation between shutdown events as reported by these different platforms.
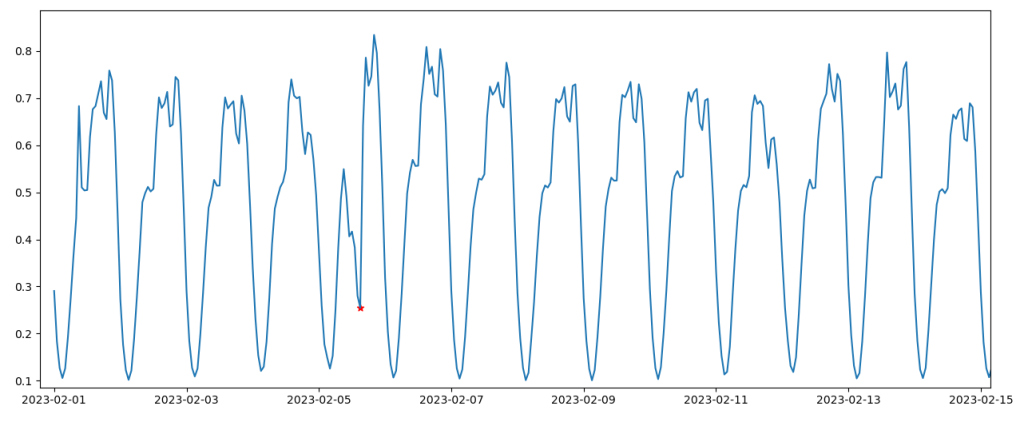
The team suggested using Seasonal Autoregressive Integrated Moving Average (SARIMA) to detect anomalies between the connectivity data each project generates. Below is an example of how the team used SARIMA to translate data from the Google Transparency report to show the TIM Sparkle outage in Italy earlier this year. You can find more visualizations here.
Data Triangulation to Infer Censorship or Shutdown Events
Just like the previous project, this team looked into confirming shutdown/censorship events by triangulating multiple datasets. The start point was to extract a list of events from the Internet Society Pulse Shutdown Tracker.
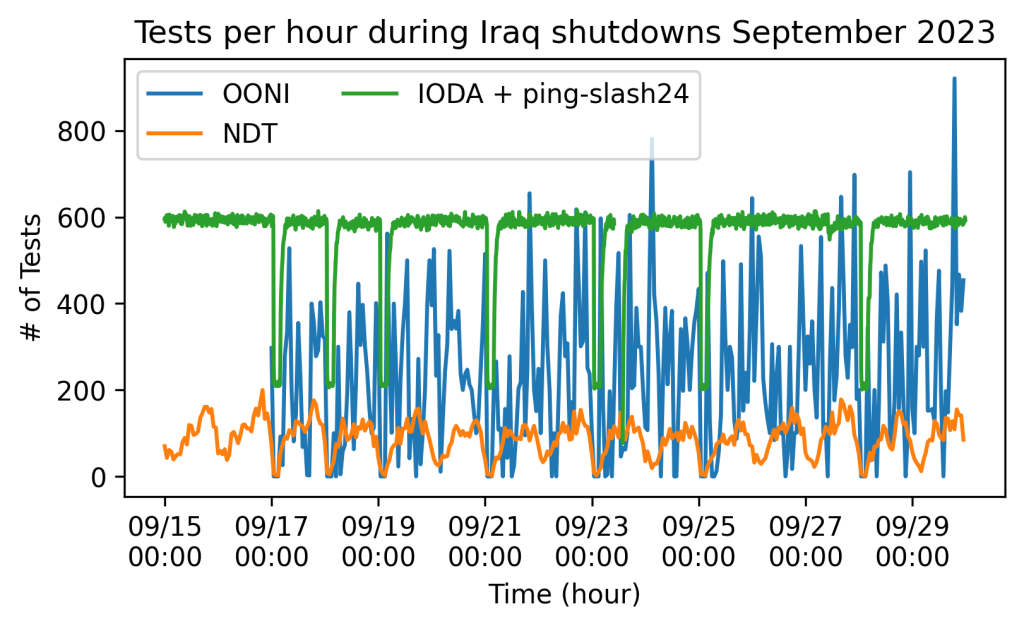
One example, illustrated in Figure 2, is the multiple shutdown events that happened in Iraq in 2023. These events lasted three to four hours and were observable via OONI, IODA, and M-Lab measurements.
Using OONI Data to Investigate IPv6 Connectivity
In this project, participants used OONI measurements to answer several IPv6-related questions. They wanted to know how many OONI probes connect over IPv6 and how many ASes fail all their IPv6 measurements. They collected data from 2021 and 2023.
First, they observed that IPv6 connectivity increased for some countries over the past two years, and some new countries started participating in OONI over the past two years. In 2023, more than 2 million websites were tested over IPv6.
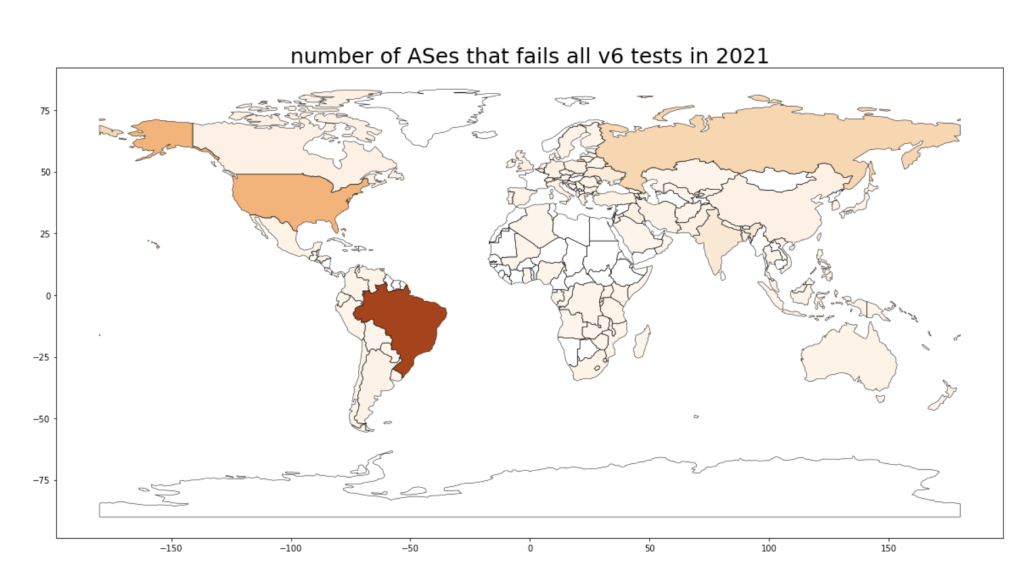
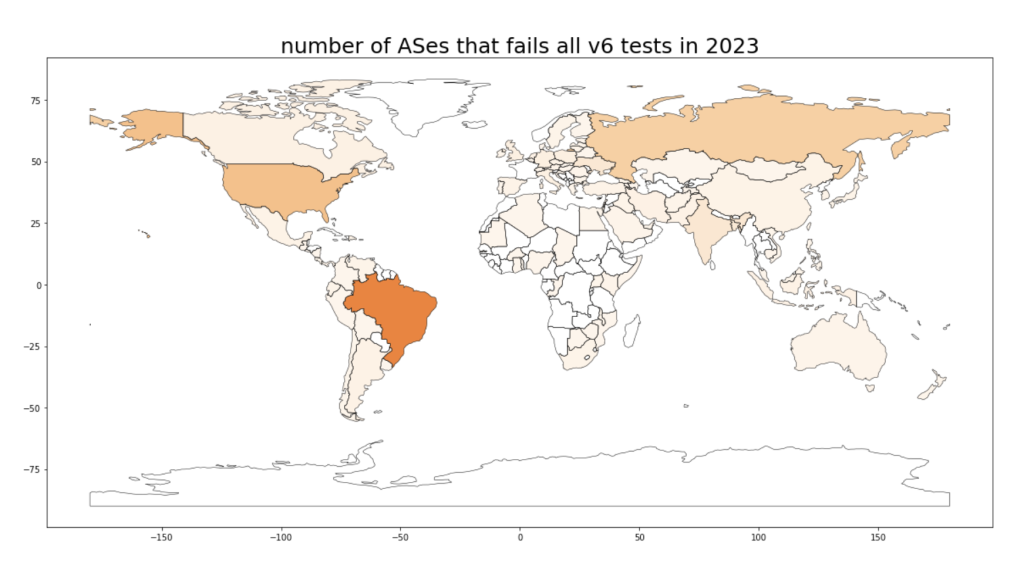
They observed that the number of OONI probes increased for some countries between 2021 (Figure 3) and 2023 (Figure 4), and the number of ASes failing IPv6 measurements decreased.
Finally, they found 40,529 IPv6 addresses globally blocked (censored) in September 2023.
The Sound of Internet Shutdowns
Hackathons also mean having some fun and exploring new ideas. One participant developed a sonification project that transforms some of the features of the IODA dataset into synthesized sounds. This way, it’s possible to listen to an Internet shutdown via your web browser by pasting the link of an IODA chart.
Below is an example of what the Internet shutdown in Iraq sounds like:
Visit the website and GitHub page to try it yourself, or watch the video below.
Thanks to all Involved
On behalf of the organizers — Internet Society, OONI, Censored Planet, M-Lab, and IODA — I’d like to thank all the participants for their fruitful engagement during the hackathon. The ideas, techniques, and new insights they produced in under a day are impressive and provide a starting point for future Internet measurement research efforts.
We would also like to thank Google for arranging the conference room and lunch, Google Jigsaw for the hackathon prizes, and Internet Society for the hackathon dinner.
Learn more about the datasets and hackathon problem statements and results.