
Can IXPs Take the Pulse of the Internet?
In short:
- Internet Exchange Points can provide a meaningful, public, and globally distributed signal of how Internet traffic evolves over time.
- A recent study of 472 IXPs shows a 49.2% increase in daily aggregate IXP traffic from January 2023 to December 2024.
- For policymakers and journalists, IXP data provides an independent baseline that does not rely solely on opaque, proprietary reporting.
Life without the Internet is getting harder to imagine each day. The Internet keeps reaching into more parts of our lives, and with that, our dependence on it keeps growing. As this societal and technological shift unfolds in real time, more stakeholders want a reliable way to assess the Internet's overall state and how it is changing.
Because no single metric can fully describe the state of a system as complex as the Internet, researchers look for high-level indicators that can still tell us a lot. One such indicator is the amount of traffic passing through a given point over time, in other words, that point's traffic profile. Long-term rises and falls, changes in the profile's shape within a day, and abrupt, short-lived spikes and drops can reveal usage trends, operational health, and potential anomalies.
That said, building a global, continuously updated "traffic observatory" is extremely difficult. This kind of data is usually either held privately by network operators or reported by global companies such as Cisco and Cloudflare, whose views are inevitably shaped by their own use cases. Ideally, what we want is a set of globally distributed vantage points that are relatively neutral in the traffic mix they observe and transparent in how they share their data.
IXPs as Vantage Points
Internet Exchange Points (IXPs) are locations where many networks interconnect and exchange traffic. This makes them a useful observation point: they see diverse traffic from many networks, instead of traffic tied to a single company or service. Just as important, many IXPs publish traffic statistics publicly and update them frequently, providing researchers with a transparent signal to independently check.
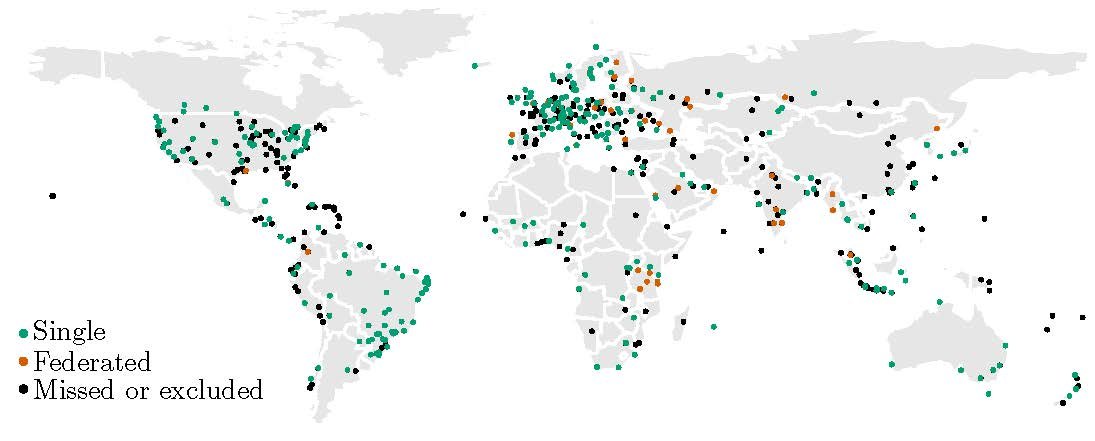
In our NINeS 2026 paper, my colleagues and I built a continuous collection pipeline and tracked publicly available traffic data from January 2023 to December 2024. The dataset covers 472 IXPs worldwide (Figure 1) and corresponds to about 87% of the publicly announced IXP port capacity listed in PeeringDB. We collected data every five minutes from APIs, web pages, and traffic plot images, then normalized all feeds so that different feeds could be compared in a single, consistent view.
What Did We See?
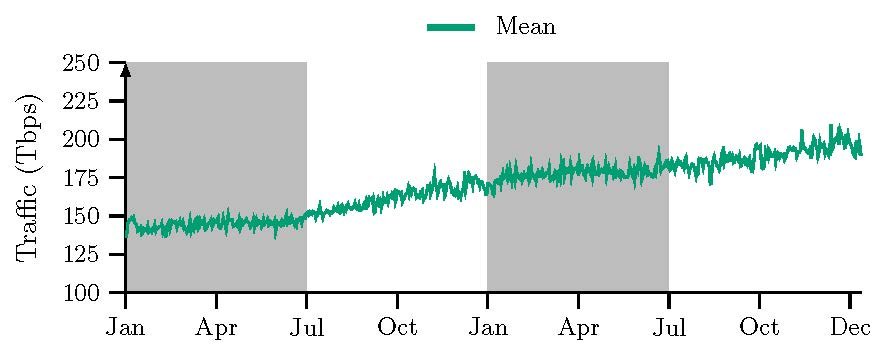
First, strong global growth. Average daily aggregate traffic in our dataset rose from about 138 Tbps to 200 Tbps in two years, a 49.2% increase (24.5% annualized). By late 2024, the peak daily aggregate exceeded 300 Tbps (Figure 2).
Second, distinct regional patterns. The data captures clear daily and weekly patterns that differ across regions. In other words, Internet traffic does not follow one universal clock. Each region has its own recurring profile, shaped by local behavior, work schedules, and culture.
Third, event-driven shifts. We observed detectable deviations during major events, including the Paris Olympics, national elections, e-commerce peaks, and the release of popular online games (Figure 3). These shifts suggest that IXP-based monitoring can help flag large-scale demand changes and anomalies in near real time.
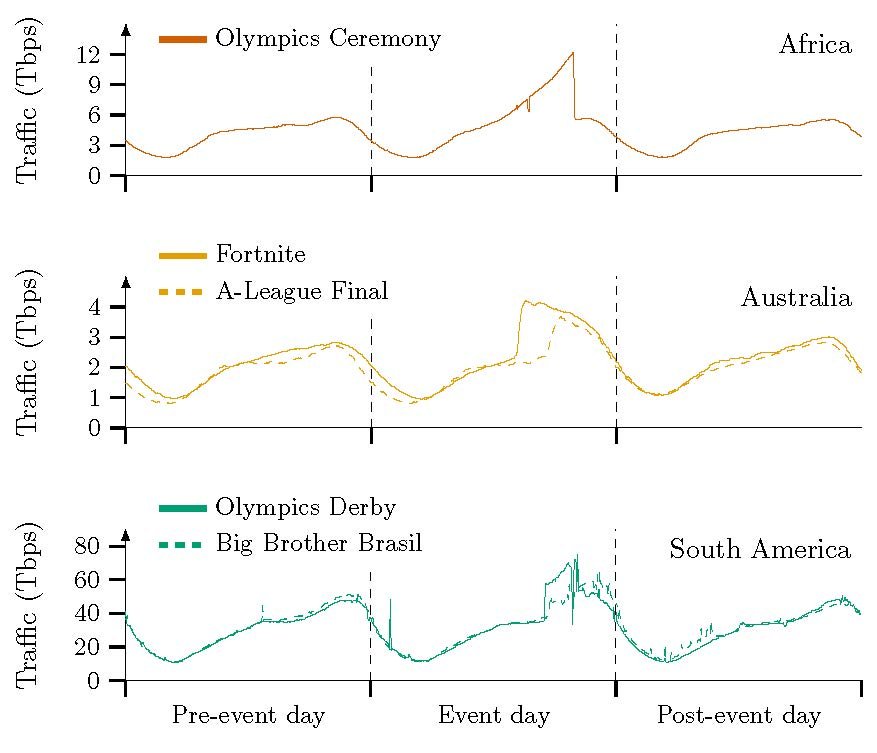
An important point is that this public IXP view is not meant to replace other views. It complements them. In some cases, different vantage points show different short-term effects during the same event. That is not a contradiction; each observation point captures a different slice of Internet activity. Putting these slices together gives a richer picture than relying on any single source.
At the same time, this is not a claim that IXPs “see the whole Internet.” They do not. Public IXP data does not include private interconnections, and coverage is uneven across regions. But this is exactly why we frame IXPs as a pulse, not a full diagnosis: a high-level, transparent indicator that is broad enough to be useful.
Why Should We Care?
For operators, this kind of signal can support capacity planning and help distinguish routine cycles from unusual shifts. For policymakers and journalists, it provides an independent baseline that does not rely solely on opaque, proprietary reporting. For researchers, it offers a reproducible foundation for future work on global anomaly and outage detection.
Just as importantly, this approach is reproducible. The underlying signal is publicly available. That means the results can be checked independently over time. This matters when claims about the Internet are used to shape policy, investment, and public debate.
Our results show IXPs can provide a meaningful, public, and globally distributed signal of how Internet traffic evolves over time. In a field where much of the most valuable data is private, we believe that is already a significant step forward.
To explore the full methodology and results, read our NINeS 2026 paper.
Ege Cem Kirci is a PhD researcher at ETH Zurich working on Internet measurement across microscopic, regional, and global scales. His work focuses on developing new measurement systems and signals to improve transparency in understanding Internet traffic dynamics.
The views expressed by the authors of this blog are their own and do not necessarily reflect the views of the Internet Society.
Image by Gerd Altmann from Pixabay