
Why More Measurement Probes Don't Mean Better Internet Data
In short:
- Measuring Internet quality does not necessarily require more measurement points but a greater understanding and reporting of anomalies.
- In their Chicago deployment, researchers found that using about half the probes still surfaced most of the distinct anomalies, with little loss in coverage.
- The team recommends that measurement projects should report the amplitude and duration of latency anomalies when they occur, not just the average performance.
When a video call freezes or a webpage takes too long to load, it rarely shows up in any official report. Unlike a full outage, where the Internet goes completely dark, these performance problems are sometimes invisible to traditional monitoring tools. And for policymakers and researchers trying to understand whether the Internet is working for everyone, this invisibility is a serious problem.
Our recent research, published in ACM CoNEXT, takes a new approach to this challenge. By studying how performance problems spread across home networks in Chicago, we found that when multiple households experience the same kind of slowdown at the same time, they tend to experience it in remarkably similar ways. This insight could potentially be a powerful tool for making Internet measurement smarter, cheaper, and more equitable.
Observing the Same Problem Twice
Large-scale Internet monitoring typically works by deploying many measurement devices, called probes, across homes, cities, and countries. Each probe continuously measures how long it takes data to travel to and from a server. One might think that the more probes you deploy, the higher your visibility is.
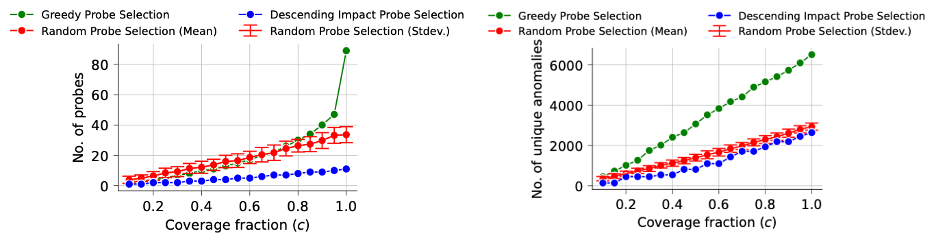
The reality is quite the opposite. We analyzed four months of high-frequency latency data from 99 probes deployed across Chicago and found a large fraction of the anomalies detected by different probes were essentially the same slowdown event hitting the same ISP at the same time. Monitoring all 99 probes independently wasn’t giving us 99 distinct views of the network. A significant chunk of it was redundant.
We developed a suite of techniques to identify which probes actually add new information and which ones confirm what other probes already see. As a result, we could capture 95% of the real performance impact detected across the entire deployment using fewer than half the probes; 44 out of 99, in our case. More importantly, the algorithm finds more than twice as many distinct anomalies compared to simply picking probes at random.
Greater Heterogeneity in Chicago’s South Side
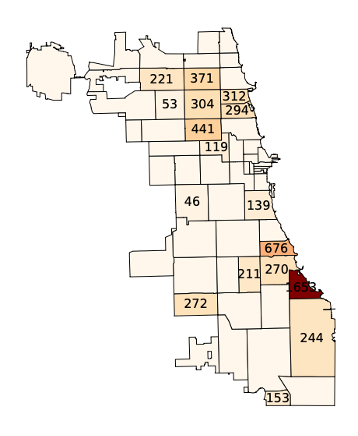
The efficiency gains matter, but what we found about the geography matters even more. When we looked at which probes our algorithm selected to keep, it consistently preserved geographic diversity. Even while cutting the probe count in half, it retained at least one probe in 17 of 21 zip codes. The algorithm wasn’t explicitly trying to be geographically fair; it was trying to find the most informative devices. But those two goals turned out to align.
Further, a single zip code on Chicago’s South Side, overlapping with the South Shore neighborhood, contributed the most probes and the most unique anomalies to our reduced set. This is a neighborhood that has been well documented as racially and economically segregated, and our data suggests that its residents are experiencing a fundamentally different and more variable Internet performance than the rest of the city. This variability is exactly what a naïve approach to probe selection might miss.
What This Means for Policymakers and Researchers
Programs like the FCC’s Measuring Broadband America (MBA), and dedicated measurement infrastructure such as RIPE Atlas, and M-Lab collectively represent years of investment in understanding Internet performance. Our approach can be applied directly to datasets from these platforms to reduce redundancy in existing deployments without additional hardware.
Further, most measurement platforms that enable academic research report a snapshot of speed and latency at a given moment. They don’t systematically track how long a slowdown lasts or how severe it is. We thus urge platforms like M-Lab and RIPE Atlas to start reporting the amplitude and duration of latency anomalies when they occur, not just the average performance. This would enable a new class of analysis: identifying neighborhoods or time periods where the gap between advertised and delivered Internet quality is widest.
Less Really Is More
The digital divide is often framed as a question of access: who has broadband and who doesn’t. But access alone doesn’t capture the full reality. Two households can both have broadband on paper while experiencing very different Internet quality in practice. Closing that gap requires measuring it first, and measuring it well.
Our work is a first step toward a measurement infrastructure that is simultaneously leaner, smarter, and more tailored to the communities that need greater visibility. The full paper, code, and dataset are publicly available for anyone who wants to build on these findings.
Taveesh Sharma is a PhD candidate in Computer Science at the University of Chicago, where he researches Internet measurement, broadband performance, and network observability.
The views expressed by the authors of this blog post are their own and do not necessarily reflect the views of the Internet Society.