
Seeing the Internet Differently with REx
In short:
- APNIC's Resource Explorer (REx) combines Internet resource allocation data, deployment measurements, routing security metrics, and topology visualization into a single filterable platform.
- Registries, operators, researchers, policymakers, and analysts can use the framework to understanding ecosystem dynamics, policy impact, and address distribution trends.
- A new resource information page bridges high-level statistical analysis and resource-level operational insight within the same interface
Over the past few years, APNIC has been steadily evolving the APNIC Resource Explorer (REx) into something more than a statistics portal. Today, we see it as a practical measurement framework for understanding how Internet number resources, deployment, and routing security evolve across regions, economies, and registries.
Recently, during a presentation for the APRICOT 2026 National Internet Registry Special Interest Group (NIR SIG), I explored a simple question: What new insights emerge when allocation data and deployment measurements are viewed together?
The answer reinforced why REx is valuable not only to registries but also to operators, researchers, policymakers, and analysts across the community.
From Directory to Data Platform
REx has been available for more than a decade (many may remember it as the Internet Directory). It is a free public service that brings together:
- Global IPv4, IPv6, and ASN delegation data across all Regional Internet Registries (RIRs) and National Internet Registries (NIRs)
- Historical trends and transfer records
- Internet measurements, including:
- IPv6 deployment
- RPKI coverage
- DNSSEC usage
- QUIC usage
- Suspicious traffic (from APNIC HoneyNet Project)
- AS interconnection visualization
The key strength of REx lies in its flexibility and interactivity. Users can filter by region, sub-region, economy, or registry, and compare multiple locations or registries within the same chart. This transforms REx from a reporting interface into an exploratory analytics tool.
Understanding Resource Growth by Registry
One powerful use case is analysing how different registries contribute to economic or regional resource growth.
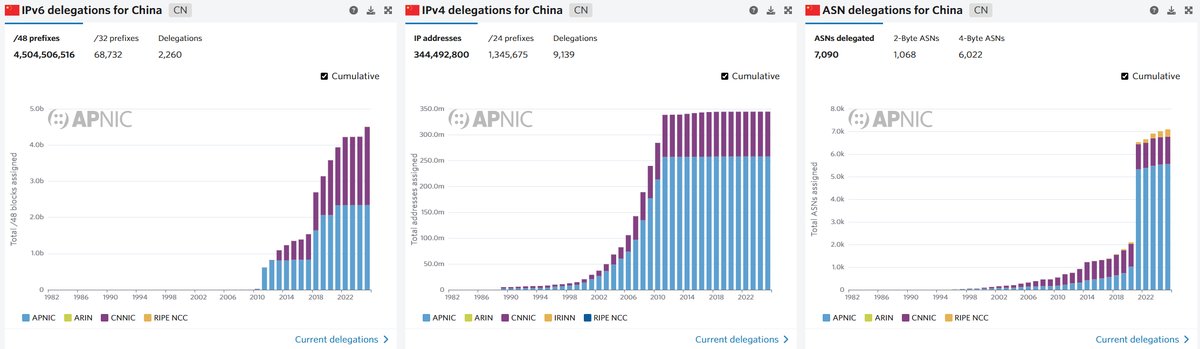
For example, REx allows users to display IPv6 delegations split by registry over time, either cumulatively or per-period (Figure 1). The examples below highlight the relative contribution of different registries to national or regional IPv6 growth.
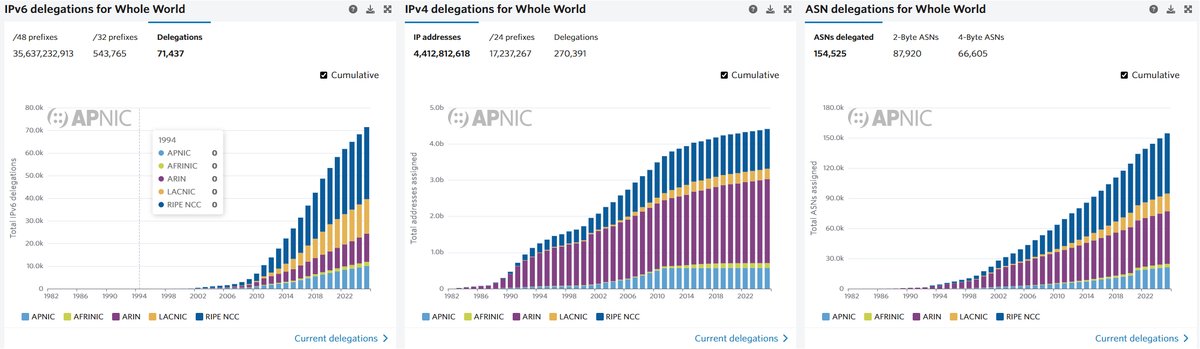
Users can also compare multiple registries side by side (Figure 2) to see growth rates, scale differences, and timing of acceleration.
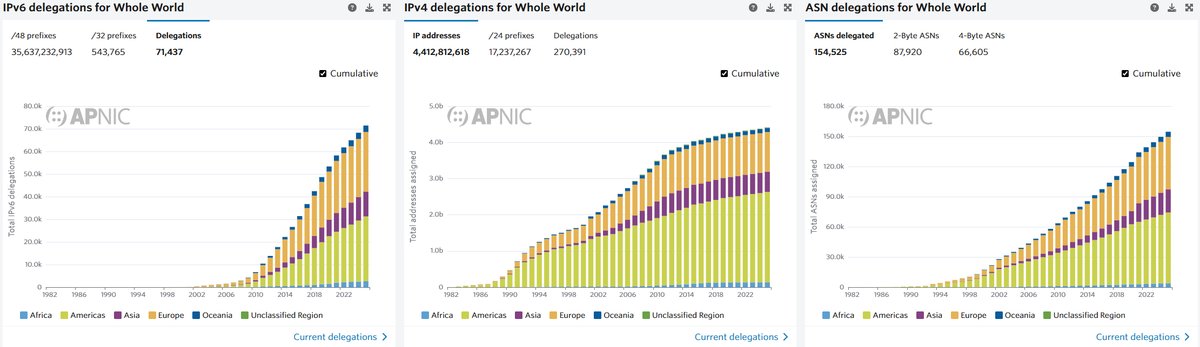
You can also break these statistics down by subregion (Figure 3). These comparisons are useful not only for registry analysis but also for understanding ecosystem dynamics, policy impact, and address distribution trends.
Allocation and Deployment: Not always aligned
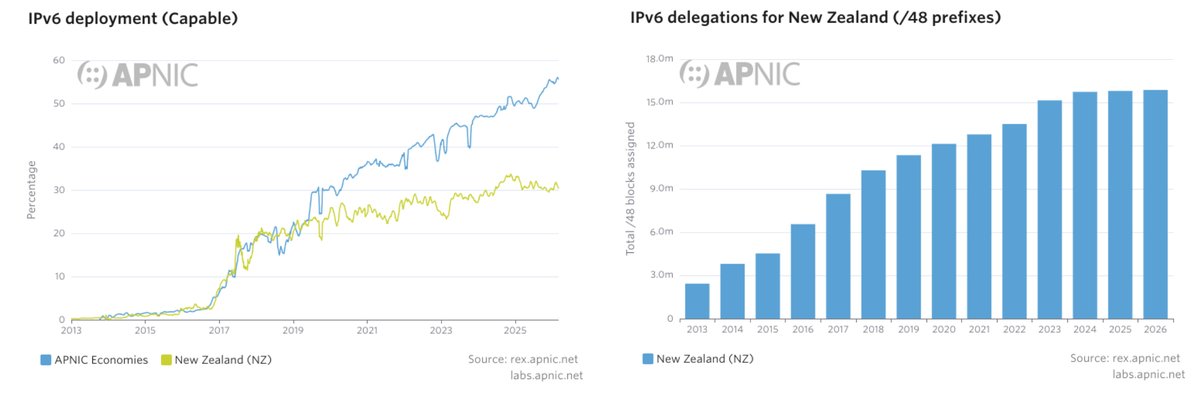
When delegation data is viewed alongside deployment metrics, a more nuanced picture emerges. Using REx, we can compare IPv6 delegations with measured IPv6 capability across selected economies.
In some cases, strong growth in IPv6 delegations is accompanied by modest deployment gains. In others, deployment outpaces recent allocation growth. This highlights an important operational reality: Delegation statistics reflect policy and registry activity. Deployment metrics, based on APNIC Labs measurement data, reflect real-world network enablement and user capability. Viewing both together provides a more complete assessment of Internet maturity.
Investigating Routing Security
REx also allows users to analyse routing security posture through RPKI coverage metrics for the world, RIR regions, subregions, and economies.
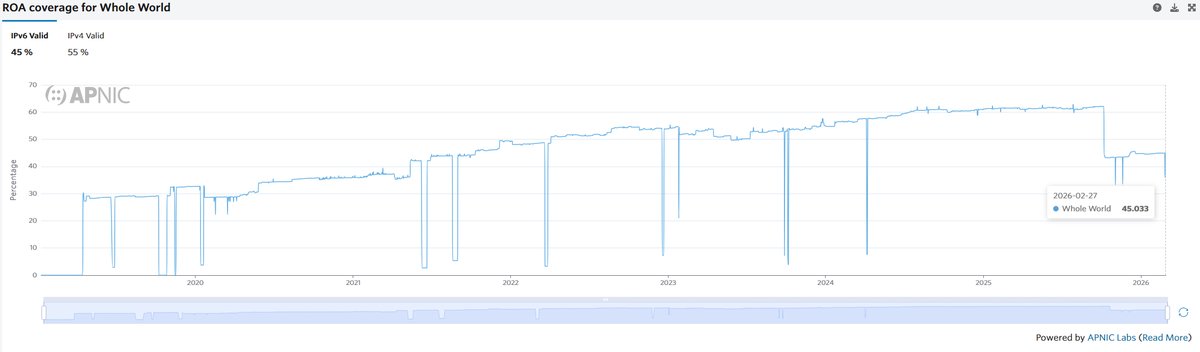
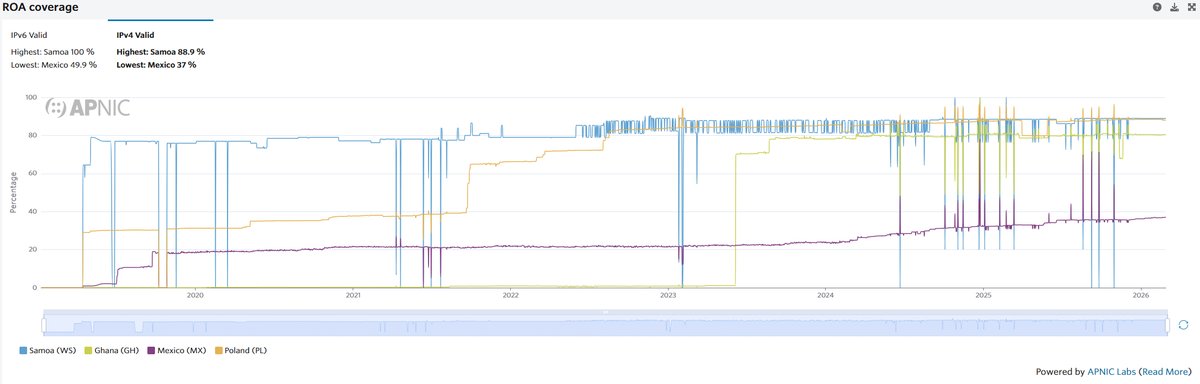
Figures 5 and 6 connect allocation growth with routing security adoption.
By comparing RPKI coverage alongside delegation and deployment trends, it becomes possible to assess whether security practices are keeping pace with network expansion.
From Macro Trends to Individual Resources
In addition to global and regional views, APNIC recently introduced a new resource information page (currently in beta). Users can enter an ASN, prefix, or IP address and access:
- Holder details
- Transfer history
- Routing status
- RPKI validation (including matched ROAs)
- Bogon information
- Whois data
This bridges high-level statistical analysis and resource-level operational insight within the same interface.
A Framework For Better Questions
REx is not just about charts. It is about enabling better questions, such as:
- Is resource growth translating into deployment?
- Is routing security adoption keeping pace with expansion?
- How do economies compare across multiple technical dimensions?
- Where are structural interconnection patterns strengthening or weakening?
By combining allocation data, deployment measurements, routing security metrics, and topology visualization into a single filterable platform, REx supports deeper analysis across the Internet ecosystem.
We encourage operators, researchers, policymakers, and community members to explore REx and experiment with combining metrics. The most interesting insights often emerge not from a single dataset, but where multiple trends intersect.
If you have suggestions to help improve REx or any of APNIC’s products and services, send us feedback.
Rafael Cintra is APNIC’s Product and Delivery Manager — Information Products.
The views expressed by the authors of this blog are their own and do not necessarily reflect the views of the Internet Society.